29
/es/
es
AIzaSyAYiBZKx7MnpbEhh9jyipgxe19OcubqV5w
April 1, 2024
29841
Euro area
EMU
false
2
1
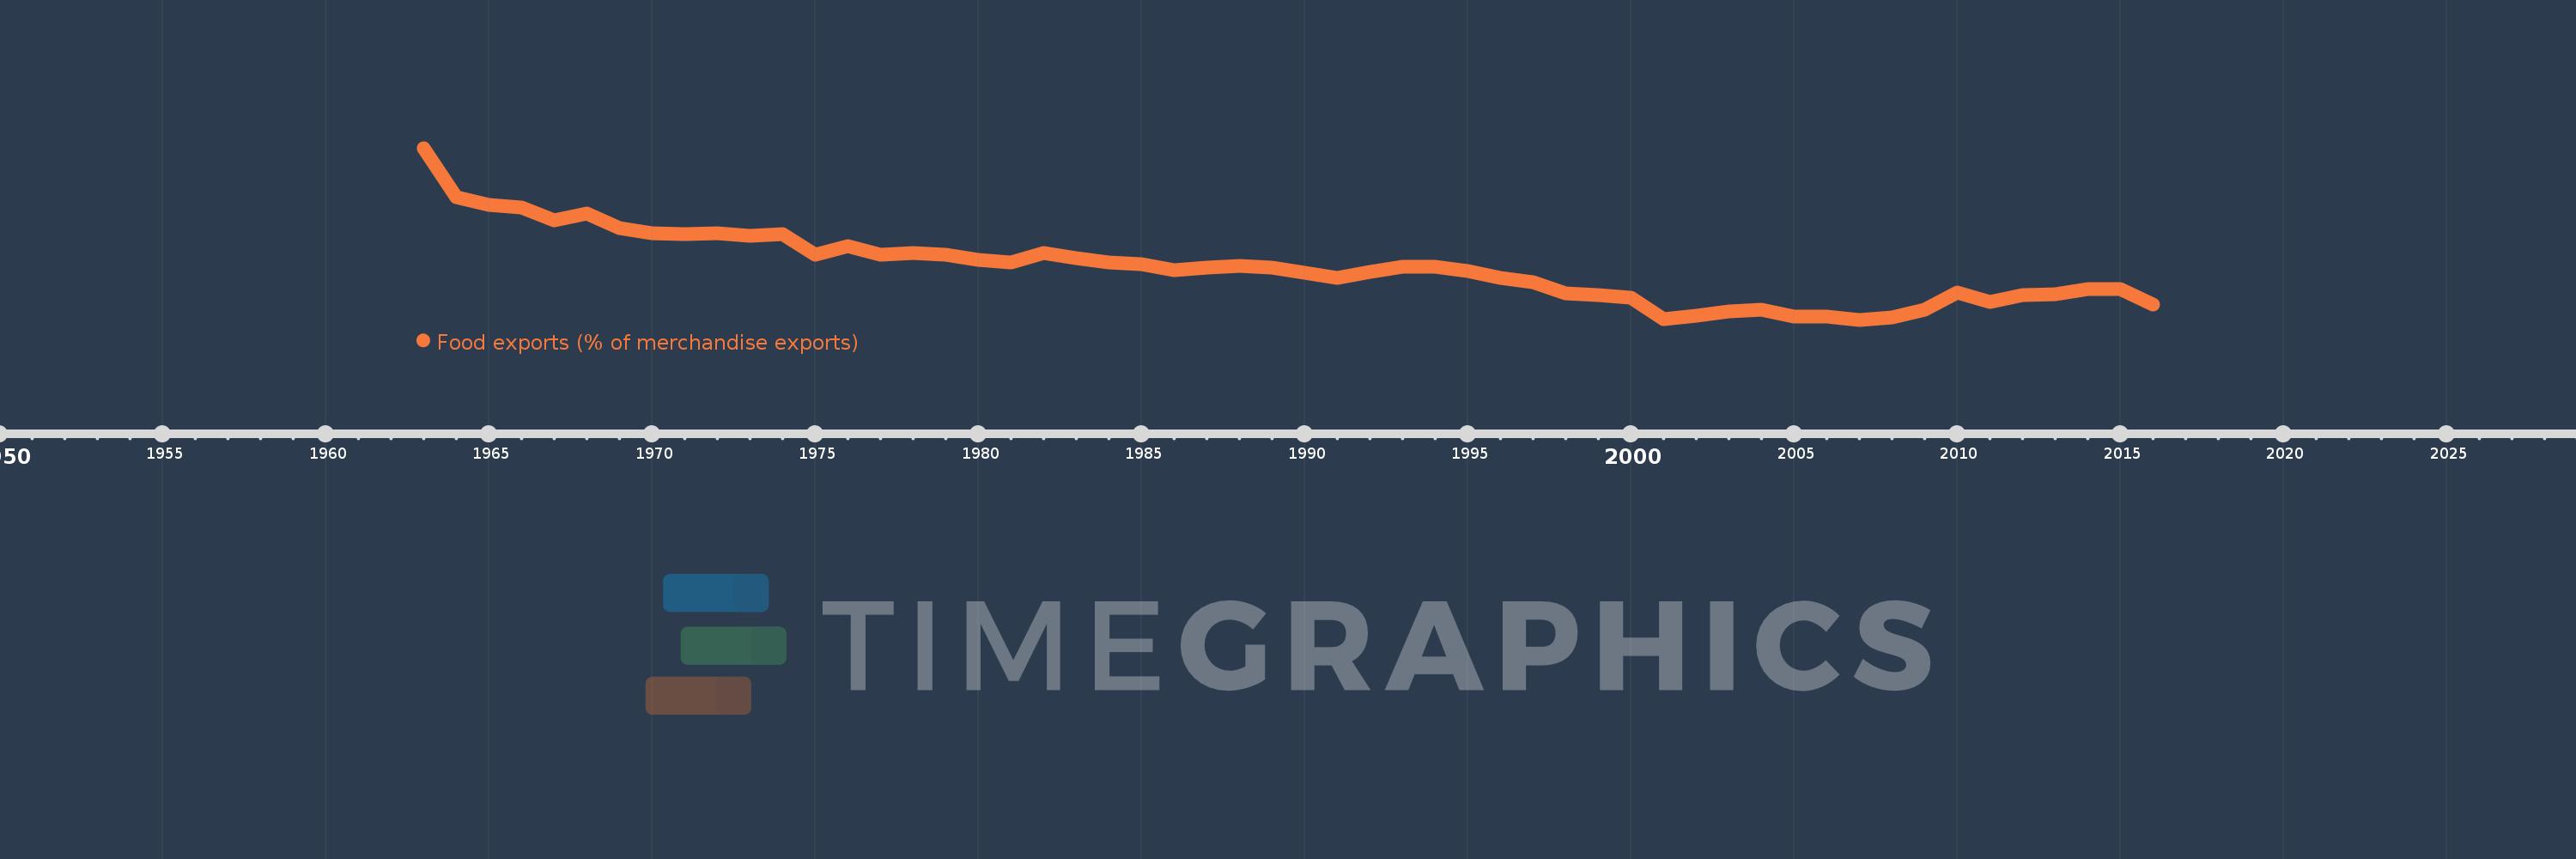
Food exports (% of merchandise exports)
2016,2015,2014,2013,2012,2011,2010,2009,2008,2007,2006,2005,2004,2003,2002,2001,2000,1999,1998,1997,1996,1995,1994,1993,1992,1991,1990,1989,1988,1987,1986,1985,1984,1983,1982,1981,1980,1979,1978,1977,1976,1975,1974,1973,1972,1971,1970,1969,1968,1967,1966,1965,1964,1963
Estas estadísticas en otros países:
AfghanistanAlbaniaAlgeriaAndorraAngolaAntigua and BarbudaArab WorldArgentinaArmeniaArubaAustraliaAustriaAzerbaijanBahamas, TheBahrainBangladeshBarbadosBelarusBelgiumBelizeBeninBermudaBhutanBoliviaBosnia and HerzegovinaBotswanaBrazilBrunei DarussalamBulgariaBurkina FasoBurundiCabo VerdeCambodiaCameroonCanadaCaribbean small statesCayman IslandsCentral African RepublicCentral Europe and the BalticsChadChileChinaColombiaComorosCongo, Dem. Rep.Congo, Rep.Costa RicaCote d'IvoireCroatiaCubaCyprusCzech RepublicDenmarkDjiboutiDominicaDominican RepublicEarly-demographic dividendEast Asia & PacificEast Asia & Pacific (excluding high income)East Asia & Pacific (IDA & IBRD countries)EcuadorEgypt, Arab Rep.El SalvadorEquatorial GuineaEritreaEstoniaEthiopiaEuro areaEurope & Central AsiaEurope & Central Asia (excluding high income)Europe & Central Asia (IDA & IBRD countries)European UnionFaroe IslandsFijiFinlandFragile and conflict affected situationsFranceFrench PolynesiaGabonGambia, TheGeorgiaGermanyGhanaGreeceGreenlandGrenadaGuatemalaGuineaGuinea-BissauGuyanaHaitiHeavily indebted poor countries (HIPC)High incomeHondurasHong Kong SAR, ChinaHungaryIBRD onlyIcelandIDA & IBRD totalIDA blendIDA onlyIDA totalIndiaIndonesiaIran, Islamic Rep.IraqIrelandIsraelItalyJamaicaJapanJordanKazakhstanKenyaKiribatiKorea, Rep.KuwaitKyrgyz RepublicLao PDRLate-demographic dividendLatin America & Caribbean Latin America & Caribbean (excluding high income)Latin America & the Caribbean (IDA & IBRD countries)LatviaLeast developed countries: UN classificationLebanonLesothoLiberiaLibyaLithuaniaLow & middle incomeLower middle incomeLuxembourgMacao SAR, ChinaMacedonia, FYRMadagascarMalawiMalaysiaMaldivesMaliMaltaMauritaniaMauritiusMexicoMiddle East & North AfricaMiddle East & North Africa (excluding high income)Middle East & North Africa (IDA & IBRD countries)Middle incomeMoldovaMongoliaMoroccoMozambiqueMyanmarNamibiaNepalNetherlandsNew CaledoniaNew ZealandNicaraguaNigerNigeriaNorth AmericaNorwayOECD membersOmanOther small statesPacific island small statesPakistanPalauPanamaPapua New GuineaParaguayPeruPhilippinesPolandPortugalPost-demographic dividendPre-demographic dividendQatarRomaniaRussian FederationRwandaSamoaSao Tome and PrincipeSaudi ArabiaSenegalSerbiaSeychellesSierra LeoneSingaporeSlovak RepublicSloveniaSmall statesSolomon IslandsSomaliaSouth AfricaSouth AsiaSouth Asia (IDA & IBRD)SpainSri LankaSt. Kitts and NevisSt. LuciaSt. Vincent and the GrenadinesSub-Saharan Africa Sub-Saharan Africa (excluding high income)Sub-Saharan Africa (IDA & IBRD countries)SudanSurinameSwazilandSwedenSwitzerlandSyrian Arab RepublicTajikistanTanzaniaThailandTimor-LesteTogoTongaTrinidad and TobagoTunisiaTurkeyTurkmenistanTurks and Caicos IslandsTuvaluUgandaUkraineUnited Arab EmiratesUnited KingdomUnited StatesUpper middle incomeUruguayVanuatuVenezuela, RBVietnamVirgin Islands (U.S.)WorldYemen, Rep.ZambiaZimbabwe línea de tiempo (timeline):
En esta escala de tiempo se presenta un gráfico de 1963 y 2016 de Euro area. Los datos de 1962 están ausentes. El número de observaciones reales por fecha: 54.
Fuente (nombre):
Indicadores del desarrollo mundial
Fuente (organización):
World Bank staff estimates from the Comtrade database maintained by the United Nations Statistics Division.
Categorías:
Private Sector, Trade
Se ha actualizado:
23 abr 2017 año
Los indicadores de los cambios de valor en los últimos años
Mínimo:
7.823
1 ene 2007 año
Máximo:
18.721
1 ene 1963 año
A la fecha de observación
Valor
Cambio absoluto
El cambio con respecto al valor anterior
1 ene 1963 año
18.721
+18.721
0.0%
1 ene 1964 año
15.579
-3.142
-16.78%
1 ene 1965 año
15.091
-0.488
-3.14%
1 ene 1966 año
14.954
-0.137
-0.91%
1 ene 1967 año
14.137
-0.817
-5.46%
1 ene 1968 año
14.585
+0.448
3.17%
1 ene 1969 año
13.659
-0.926
-6.35%
1 ene 1970 año
13.331
-0.328
-2.4%
1 ene 1971 año
13.261
-0.07
-0.53%
1 ene 1972 año
13.295
+0.035
0.26%
1 ene 1973 año
13.143
-0.152
-1.14%
1 ene 1974 año
13.261
+0.117
0.89%
1 ene 1975 año
11.972
-1.289
-9.72%
1 ene 1976 año
12.496
+0.524
4.38%
1 ene 1977 año
11.947
-0.549
-4.39%
1 ene 1978 año
12.06
+0.113
0.95%
1 ene 1979 año
11.931
-0.128
-1.07%
1 ene 1980 año
11.616
-0.315
-2.64%
1 ene 1981 año
11.444
-0.172
-1.48%
1 ene 1982 año
12.076
+0.632
5.53%
1 ene 1983 año
11.725
-0.351
-2.91%
1 ene 1984 año
11.438
-0.286
-2.44%
1 ene 1985 año
11.336
-0.102
-0.9%
1 ene 1986 año
10.989
-0.347
-3.06%
1 ene 1987 año
11.154
+0.165
1.5%
1 ene 1988 año
11.25
+0.096
0.86%
1 ene 1989 año
11.105
-0.146
-1.29%
1 ene 1990 año
10.804
-0.3
-2.7%
1 ene 1991 año
10.471
-0.334
-3.09%
1 ene 1992 año
10.85
+0.379
3.62%
1 ene 1993 año
11.212
+0.362
3.33%
1 ene 1994 año
11.164
-0.047
-0.42%
1 ene 1995 año
10.891
-0.273
-2.44%
1 ene 1996 año
10.455
-0.436
-4.01%
1 ene 1997 año
10.209
-0.246
-2.36%
1 ene 1998 año
9.498
-0.711
-6.96%
1 ene 1999 año
9.404
-0.094
-0.99%
1 ene 2000 año
9.209
-0.195
-2.07%
1 ene 2001 año
7.842
-1.367
-14.84%
1 ene 2002 año
8.077
+0.234
2.99%
1 ene 2003 año
8.375
+0.298
3.7%
1 ene 2004 año
8.436
+0.061
0.73%
1 ene 2005 año
8.032
-0.404
-4.79%
1 ene 2006 año
8.025
-0.007
-0.09%
1 ene 2007 año
7.823
-0.202
-2.52%
1 ene 2008 año
7.967
+0.144
1.84%
1 ene 2009 año
8.442
+0.476
5.97%
1 ene 2010 año
9.524
+1.081
12.81%
1 ene 2011 año
8.966
-0.557
-5.85%
1 ene 2012 año
9.39
+0.424
4.72%
1 ene 2013 año
9.466
+0.076
0.81%
1 ene 2014 año
9.793
+0.327
3.45%
1 ene 2015 año
9.749
-0.044
-0.45%
1 ene 2016 año
8.795
-0.954
-9.79%
Ranking de los países por los datos estadísticos actuales


Comentarios: