29
/es/
es
AIzaSyAYiBZKx7MnpbEhh9jyipgxe19OcubqV5w
April 1, 2024
235747
Senegal
SEN
true
2
1
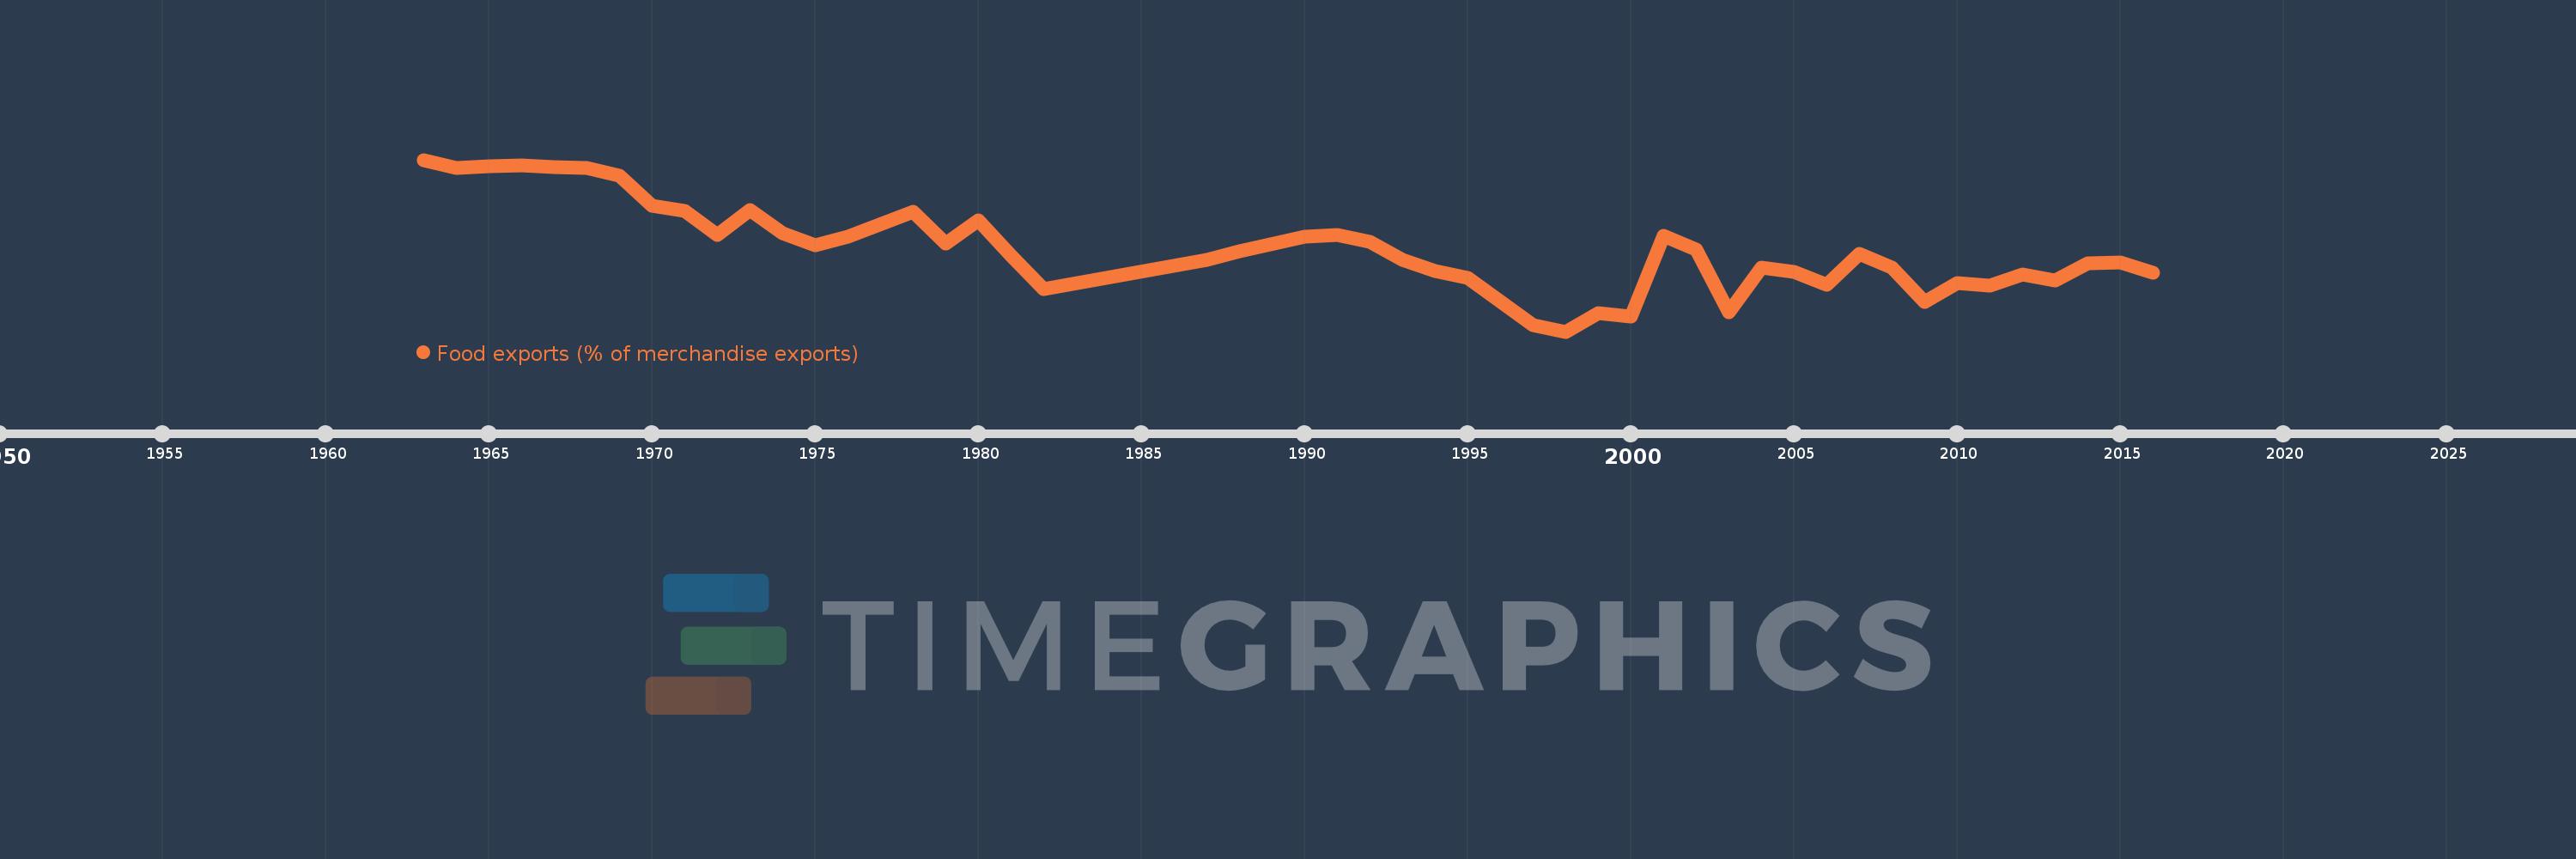
Food exports (% of merchandise exports)
2016,2015,2014,2013,2012,2011,2010,2009,2008,2007,2006,2005,2004,2003,2002,2001,2000,1999,1998,1997,1995,1994,1993,1992,1991,1990,1988,1987,1982,1981,1980,1979,1978,1976,1975,1974,1973,1972,1971,1970,1969,1968,1967,1966,1965,1964,1963
Estas estadísticas en otros países:
AfghanistanAlbaniaAlgeriaAndorraAngolaAntigua and BarbudaArab WorldArgentinaArmeniaArubaAustraliaAustriaAzerbaijanBahamas, TheBahrainBangladeshBarbadosBelarusBelgiumBelizeBeninBermudaBhutanBoliviaBosnia and HerzegovinaBotswanaBrazilBrunei DarussalamBulgariaBurkina FasoBurundiCabo VerdeCambodiaCameroonCanadaCaribbean small statesCayman IslandsCentral African RepublicCentral Europe and the BalticsChadChileChinaColombiaComorosCongo, Dem. Rep.Congo, Rep.Costa RicaCote d'IvoireCroatiaCubaCyprusCzech RepublicDenmarkDjiboutiDominicaDominican RepublicEarly-demographic dividendEast Asia & PacificEast Asia & Pacific (excluding high income)East Asia & Pacific (IDA & IBRD countries)EcuadorEgypt, Arab Rep.El SalvadorEquatorial GuineaEritreaEstoniaEthiopiaEuro areaEurope & Central AsiaEurope & Central Asia (excluding high income)Europe & Central Asia (IDA & IBRD countries)European UnionFaroe IslandsFijiFinlandFragile and conflict affected situationsFranceFrench PolynesiaGabonGambia, TheGeorgiaGermanyGhanaGreeceGreenlandGrenadaGuatemalaGuineaGuinea-BissauGuyanaHaitiHeavily indebted poor countries (HIPC)High incomeHondurasHong Kong SAR, ChinaHungaryIBRD onlyIcelandIDA & IBRD totalIDA blendIDA onlyIDA totalIndiaIndonesiaIran, Islamic Rep.IraqIrelandIsraelItalyJamaicaJapanJordanKazakhstanKenyaKiribatiKorea, Rep.KuwaitKyrgyz RepublicLao PDRLate-demographic dividendLatin America & Caribbean Latin America & Caribbean (excluding high income)Latin America & the Caribbean (IDA & IBRD countries)LatviaLeast developed countries: UN classificationLebanonLesothoLiberiaLibyaLithuaniaLow & middle incomeLower middle incomeLuxembourgMacao SAR, ChinaMacedonia, FYRMadagascarMalawiMalaysiaMaldivesMaliMaltaMauritaniaMauritiusMexicoMiddle East & North AfricaMiddle East & North Africa (excluding high income)Middle East & North Africa (IDA & IBRD countries)Middle incomeMoldovaMongoliaMoroccoMozambiqueMyanmarNamibiaNepalNetherlandsNew CaledoniaNew ZealandNicaraguaNigerNigeriaNorth AmericaNorwayOECD membersOmanOther small statesPacific island small statesPakistanPalauPanamaPapua New GuineaParaguayPeruPhilippinesPolandPortugalPost-demographic dividendPre-demographic dividendQatarRomaniaRussian FederationRwandaSamoaSao Tome and PrincipeSaudi ArabiaSenegalSerbiaSeychellesSierra LeoneSingaporeSlovak RepublicSloveniaSmall statesSolomon IslandsSomaliaSouth AfricaSouth AsiaSouth Asia (IDA & IBRD)SpainSri LankaSt. Kitts and NevisSt. LuciaSt. Vincent and the GrenadinesSub-Saharan Africa Sub-Saharan Africa (excluding high income)Sub-Saharan Africa (IDA & IBRD countries)SudanSurinameSwazilandSwedenSwitzerlandSyrian Arab RepublicTajikistanTanzaniaThailandTimor-LesteTogoTongaTrinidad and TobagoTunisiaTurkeyTurkmenistanTurks and Caicos IslandsTuvaluUgandaUkraineUnited Arab EmiratesUnited KingdomUnited StatesUpper middle incomeUruguayVanuatuVenezuela, RBVietnamVirgin Islands (U.S.)WorldYemen, Rep.ZambiaZimbabwe línea de tiempo (timeline):
En esta escala de tiempo se presenta un gráfico de 1963 y 2016 de Senegal. Los datos de 1962 están ausentes. El número de observaciones reales por fecha: 47.
Fuente (nombre):
Indicadores del desarrollo mundial
Fuente (organización):
World Bank staff estimates from the Comtrade database maintained by the United Nations Statistics Division.
Categorías:
Private Sector, Trade
Se ha actualizado:
23 abr 2017 año
Los indicadores de los cambios de valor en los últimos años
Mínimo:
6.211
1 ene 1998 año
Máximo:
89.438
1 ene 1963 año
A la fecha de observación
Valor
Cambio absoluto
El cambio con respecto al valor anterior
1 ene 1963 año
89.438
+89.438
0.0%
1 ene 1964 año
85.299
-4.139
-4.63%
1 ene 1965 año
86.343
+1.044
1.22%
1 ene 1966 año
86.853
+0.51
0.59%
1 ene 1967 año
86.043
-0.81
-0.93%
1 ene 1968 año
85.584
-0.459
-0.53%
1 ene 1969 año
81.703
-3.881
-4.53%
1 ene 1970 año
67.091
-14.612
-17.88%
1 ene 1971 año
64.758
-2.333
-3.48%
1 ene 1972 año
52.992
-11.766
-18.17%
1 ene 1973 año
64.957
+11.965
22.58%
1 ene 1974 año
53.659
-11.298
-17.39%
1 ene 1975 año
48.216
-5.443
-10.14%
1 ene 1976 año
52.042
+3.826
7.94%
1 ene 1978 año
64.386
+12.343
23.72%
1 ene 1979 año
48.711
-15.675
-24.35%
1 ene 1980 año
59.983
+11.273
23.14%
1 ene 1981 año
43.047
-16.936
-28.23%
1 ene 1982 año
26.682
-16.365
-38.02%
1 ene 1987 año
41.113
+14.431
54.09%
1 ene 1988 año
45.297
+4.184
10.18%
1 ene 1990 año
52.103
+6.806
15.03%
1 ene 1991 año
53.171
+1.068
2.05%
1 ene 1992 año
49.686
-3.485
-6.55%
1 ene 1993 año
41.028
-8.658
-17.42%
1 ene 1994 año
35.583
-5.445
-13.27%
1 ene 1995 año
32.178
-3.405
-9.57%
1 ene 1997 año
9.492
-22.686
-70.5%
1 ene 1998 año
6.211
-3.281
-34.56%
1 ene 1999 año
15.321
+9.11
146.67%
1 ene 2000 año
13.443
-1.879
-12.26%
1 ene 2001 año
52.424
+38.981
289.98%
1 ene 2002 año
46.14
-6.283
-11.99%
1 ene 2003 año
15.59
-30.55
-66.21%
1 ene 2004 año
37.145
+21.555
138.26%
1 ene 2005 año
35.011
-2.134
-5.75%
1 ene 2006 año
28.797
-6.213
-17.75%
1 ene 2007 año
43.76
+14.963
51.96%
1 ene 2008 año
37.087
-6.672
-15.25%
1 ene 2009 año
20.586
-16.501
-44.49%
1 ene 2010 año
29.519
+8.933
43.39%
1 ene 2011 año
28.56
-0.959
-3.25%
1 ene 2012 año
33.836
+5.276
18.47%
1 ene 2013 año
31.168
-2.669
-7.89%
1 ene 2014 año
39.29
+8.123
26.06%
1 ene 2015 año
39.766
+0.476
1.21%
1 ene 2016 año
34.739
-5.027
-12.64%
Ranking de los países por los datos estadísticos actuales


Comentarios: