29
/es/
es
AIzaSyAYiBZKx7MnpbEhh9jyipgxe19OcubqV5w
April 1, 2024
131970
Fiji
FJI
true
2
1
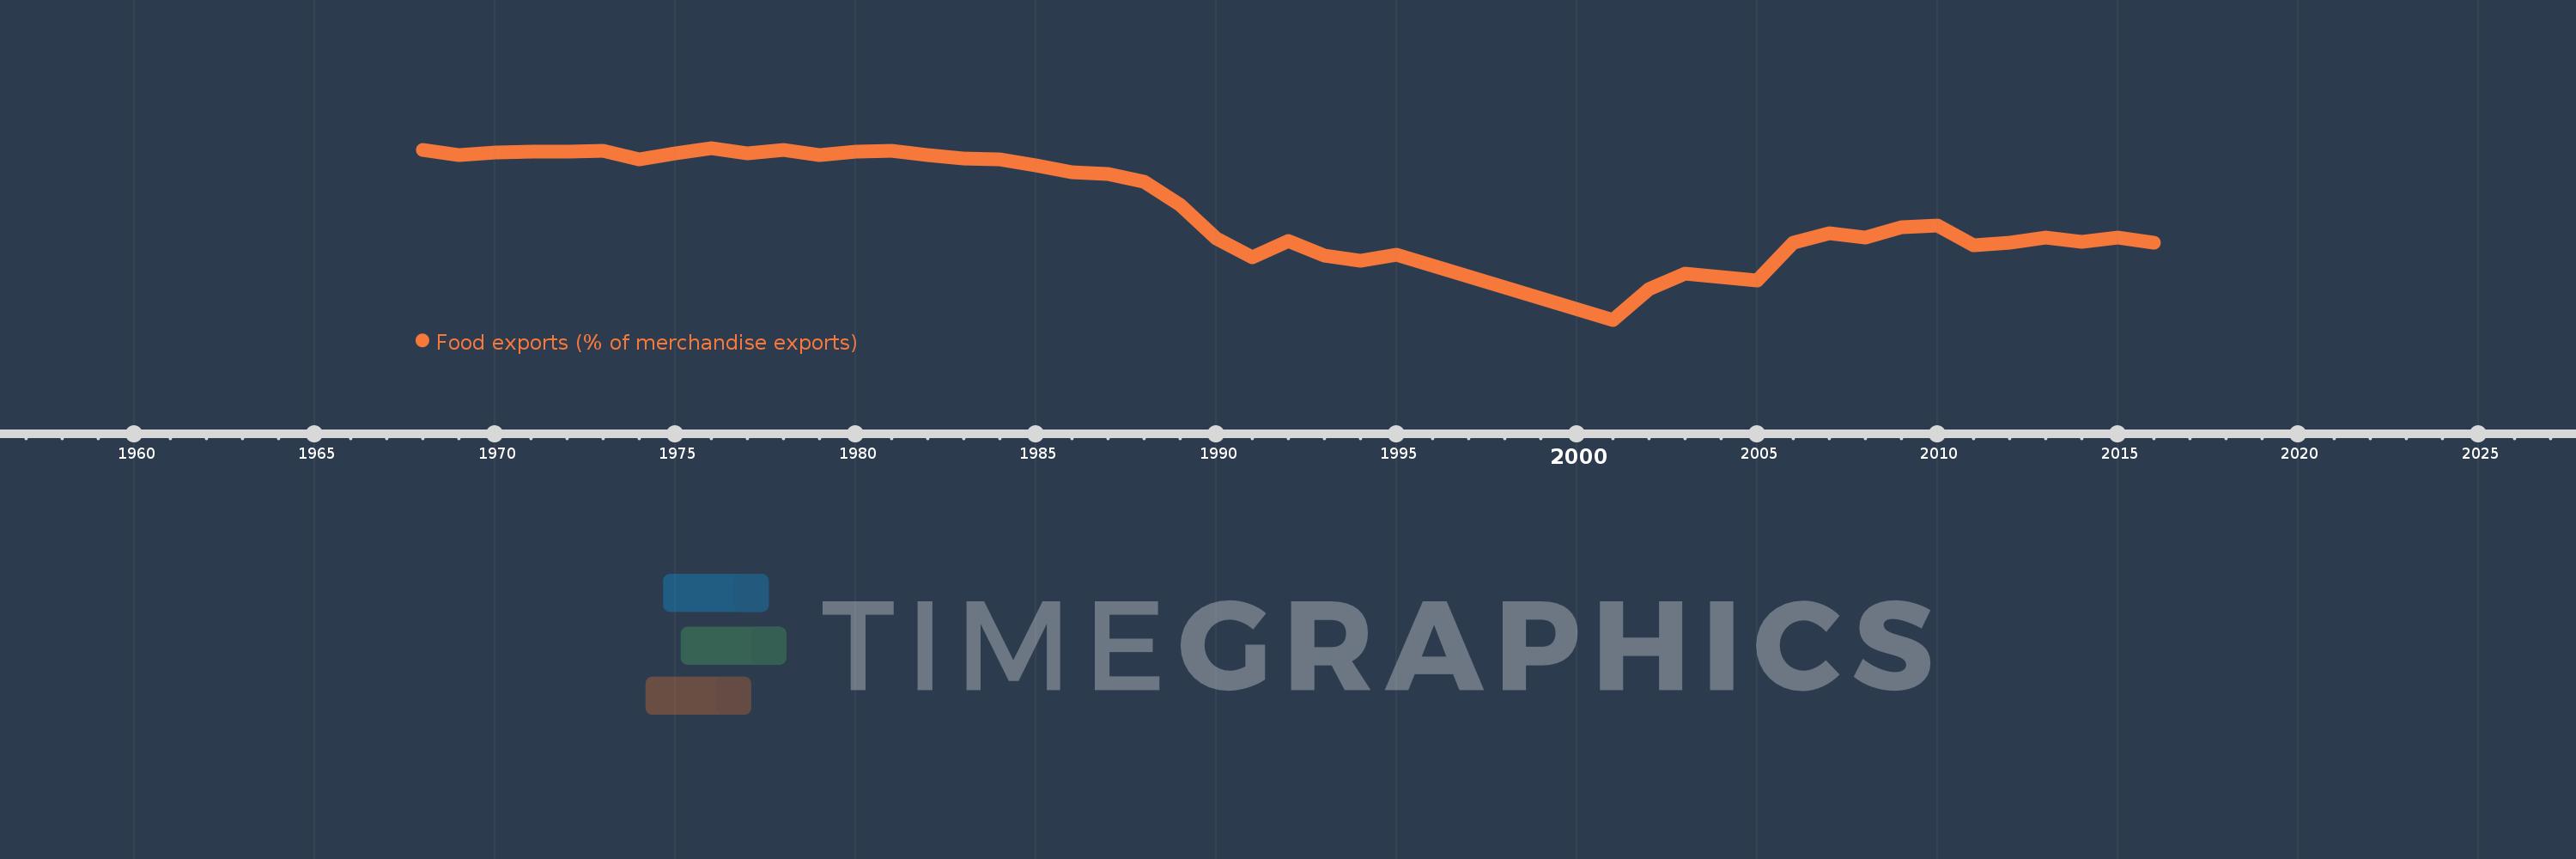
Food exports (% of merchandise exports)
2016,2015,2014,2013,2012,2011,2010,2009,2008,2007,2006,2005,2004,2003,2002,2001,1995,1994,1993,1992,1991,1990,1989,1988,1987,1986,1985,1984,1983,1982,1981,1980,1979,1978,1977,1976,1975,1974,1973,1972,1971,1970,1969,1968
Estas estadísticas en otros países:
AfghanistanAlbaniaAlgeriaAndorraAngolaAntigua and BarbudaArab WorldArgentinaArmeniaArubaAustraliaAustriaAzerbaijanBahamas, TheBahrainBangladeshBarbadosBelarusBelgiumBelizeBeninBermudaBhutanBoliviaBosnia and HerzegovinaBotswanaBrazilBrunei DarussalamBulgariaBurkina FasoBurundiCabo VerdeCambodiaCameroonCanadaCaribbean small statesCayman IslandsCentral African RepublicCentral Europe and the BalticsChadChileChinaColombiaComorosCongo, Dem. Rep.Congo, Rep.Costa RicaCote d'IvoireCroatiaCubaCyprusCzech RepublicDenmarkDjiboutiDominicaDominican RepublicEarly-demographic dividendEast Asia & PacificEast Asia & Pacific (excluding high income)East Asia & Pacific (IDA & IBRD countries)EcuadorEgypt, Arab Rep.El SalvadorEquatorial GuineaEritreaEstoniaEthiopiaEuro areaEurope & Central AsiaEurope & Central Asia (excluding high income)Europe & Central Asia (IDA & IBRD countries)European UnionFaroe IslandsFijiFinlandFragile and conflict affected situationsFranceFrench PolynesiaGabonGambia, TheGeorgiaGermanyGhanaGreeceGreenlandGrenadaGuatemalaGuineaGuinea-BissauGuyanaHaitiHeavily indebted poor countries (HIPC)High incomeHondurasHong Kong SAR, ChinaHungaryIBRD onlyIcelandIDA & IBRD totalIDA blendIDA onlyIDA totalIndiaIndonesiaIran, Islamic Rep.IraqIrelandIsraelItalyJamaicaJapanJordanKazakhstanKenyaKiribatiKorea, Rep.KuwaitKyrgyz RepublicLao PDRLate-demographic dividendLatin America & Caribbean Latin America & Caribbean (excluding high income)Latin America & the Caribbean (IDA & IBRD countries)LatviaLeast developed countries: UN classificationLebanonLesothoLiberiaLibyaLithuaniaLow & middle incomeLower middle incomeLuxembourgMacao SAR, ChinaMacedonia, FYRMadagascarMalawiMalaysiaMaldivesMaliMaltaMauritaniaMauritiusMexicoMiddle East & North AfricaMiddle East & North Africa (excluding high income)Middle East & North Africa (IDA & IBRD countries)Middle incomeMoldovaMongoliaMoroccoMozambiqueMyanmarNamibiaNepalNetherlandsNew CaledoniaNew ZealandNicaraguaNigerNigeriaNorth AmericaNorwayOECD membersOmanOther small statesPacific island small statesPakistanPalauPanamaPapua New GuineaParaguayPeruPhilippinesPolandPortugalPost-demographic dividendPre-demographic dividendQatarRomaniaRussian FederationRwandaSamoaSao Tome and PrincipeSaudi ArabiaSenegalSerbiaSeychellesSierra LeoneSingaporeSlovak RepublicSloveniaSmall statesSolomon IslandsSomaliaSouth AfricaSouth AsiaSouth Asia (IDA & IBRD)SpainSri LankaSt. Kitts and NevisSt. LuciaSt. Vincent and the GrenadinesSub-Saharan Africa Sub-Saharan Africa (excluding high income)Sub-Saharan Africa (IDA & IBRD countries)SudanSurinameSwazilandSwedenSwitzerlandSyrian Arab RepublicTajikistanTanzaniaThailandTimor-LesteTogoTongaTrinidad and TobagoTunisiaTurkeyTurkmenistanTurks and Caicos IslandsTuvaluUgandaUkraineUnited Arab EmiratesUnited KingdomUnited StatesUpper middle incomeUruguayVanuatuVenezuela, RBVietnamVirgin Islands (U.S.)WorldYemen, Rep.ZambiaZimbabwe línea de tiempo (timeline):
En esta escala de tiempo se presenta un gráfico de 1968 y 2016 de Fiji. Los datos de 1967 están ausentes. El número de observaciones reales por fecha: 44.
Fuente (nombre):
Indicadores del desarrollo mundial
Fuente (organización):
World Bank staff estimates from the Comtrade database maintained by the United Nations Statistics Division.
Categorías:
Private Sector, Trade
Se ha actualizado:
23 abr 2017 año
Los indicadores de los cambios de valor en los últimos años
Mínimo:
37.516
1 ene 2001 año
Máximo:
96.93
1 ene 1976 año
A la fecha de observación
Valor
Cambio absoluto
El cambio con respecto al valor anterior
1 ene 1968 año
96.11
+96.11
0.0%
1 ene 1969 año
94.338
-1.771
-1.84%
1 ene 1970 año
95.324
+0.985
1.04%
1 ene 1971 año
95.643
+0.319
0.33%
1 ene 1972 año
95.629
-0.014
-0.01%
1 ene 1973 año
95.909
+0.28
0.29%
1 ene 1974 año
92.99
-2.918
-3.04%
1 ene 1975 año
94.983
+1.993
2.14%
1 ene 1976 año
96.93
+1.947
2.05%
1 ene 1977 año
94.941
-1.988
-2.05%
1 ene 1978 año
96.334
+1.392
1.47%
1 ene 1979 año
94.341
-1.993
-2.07%
1 ene 1980 año
95.722
+1.381
1.46%
1 ene 1981 año
95.857
+0.135
0.14%
1 ene 1982 año
94.58
-1.278
-1.33%
1 ene 1983 año
93.347
-1.233
-1.3%
1 ene 1984 año
93.045
-0.302
-0.32%
1 ene 1985 año
90.946
-2.099
-2.26%
1 ene 1986 año
88.467
-2.479
-2.73%
1 ene 1987 año
88.039
-0.428
-0.48%
1 ene 1988 año
85.108
-2.932
-3.33%
1 ene 1989 año
77.356
-7.751
-9.11%
1 ene 1990 año
65.679
-11.677
-15.1%
1 ene 1991 año
58.999
-6.681
-10.17%
1 ene 1992 año
64.854
+5.855
9.92%
1 ene 1993 año
59.752
-5.102
-7.87%
1 ene 1994 año
57.958
-1.794
-3.0%
1 ene 1995 año
59.898
+1.94
3.35%
1 ene 2001 año
37.516
-22.382
-37.37%
1 ene 2002 año
48.204
+10.688
28.49%
1 ene 2003 año
53.38
+5.176
10.74%
1 ene 2004 año
52.138
-1.242
-2.33%
1 ene 2005 año
51.039
-1.098
-2.11%
1 ene 2006 año
64.269
+13.23
25.92%
1 ene 2007 año
67.483
+3.214
5.0%
1 ene 2008 año
65.877
-1.606
-2.38%
1 ene 2009 año
69.556
+3.679
5.58%
1 ene 2010 año
70.178
+0.621
0.89%
1 ene 2011 año
63.329
-6.848
-9.76%
1 ene 2012 año
64.062
+0.733
1.16%
1 ene 2013 año
66.025
+1.962
3.06%
1 ene 2014 año
64.381
-1.643
-2.49%
1 ene 2015 año
66.029
+1.648
2.56%
1 ene 2016 año
64.302
-1.728
-2.62%
Ranking de los países por los datos estadísticos actuales


Comentarios: