29
/es/
es
AIzaSyAYiBZKx7MnpbEhh9jyipgxe19OcubqV5w
April 1, 2024
154576
India
IND
true
2
1
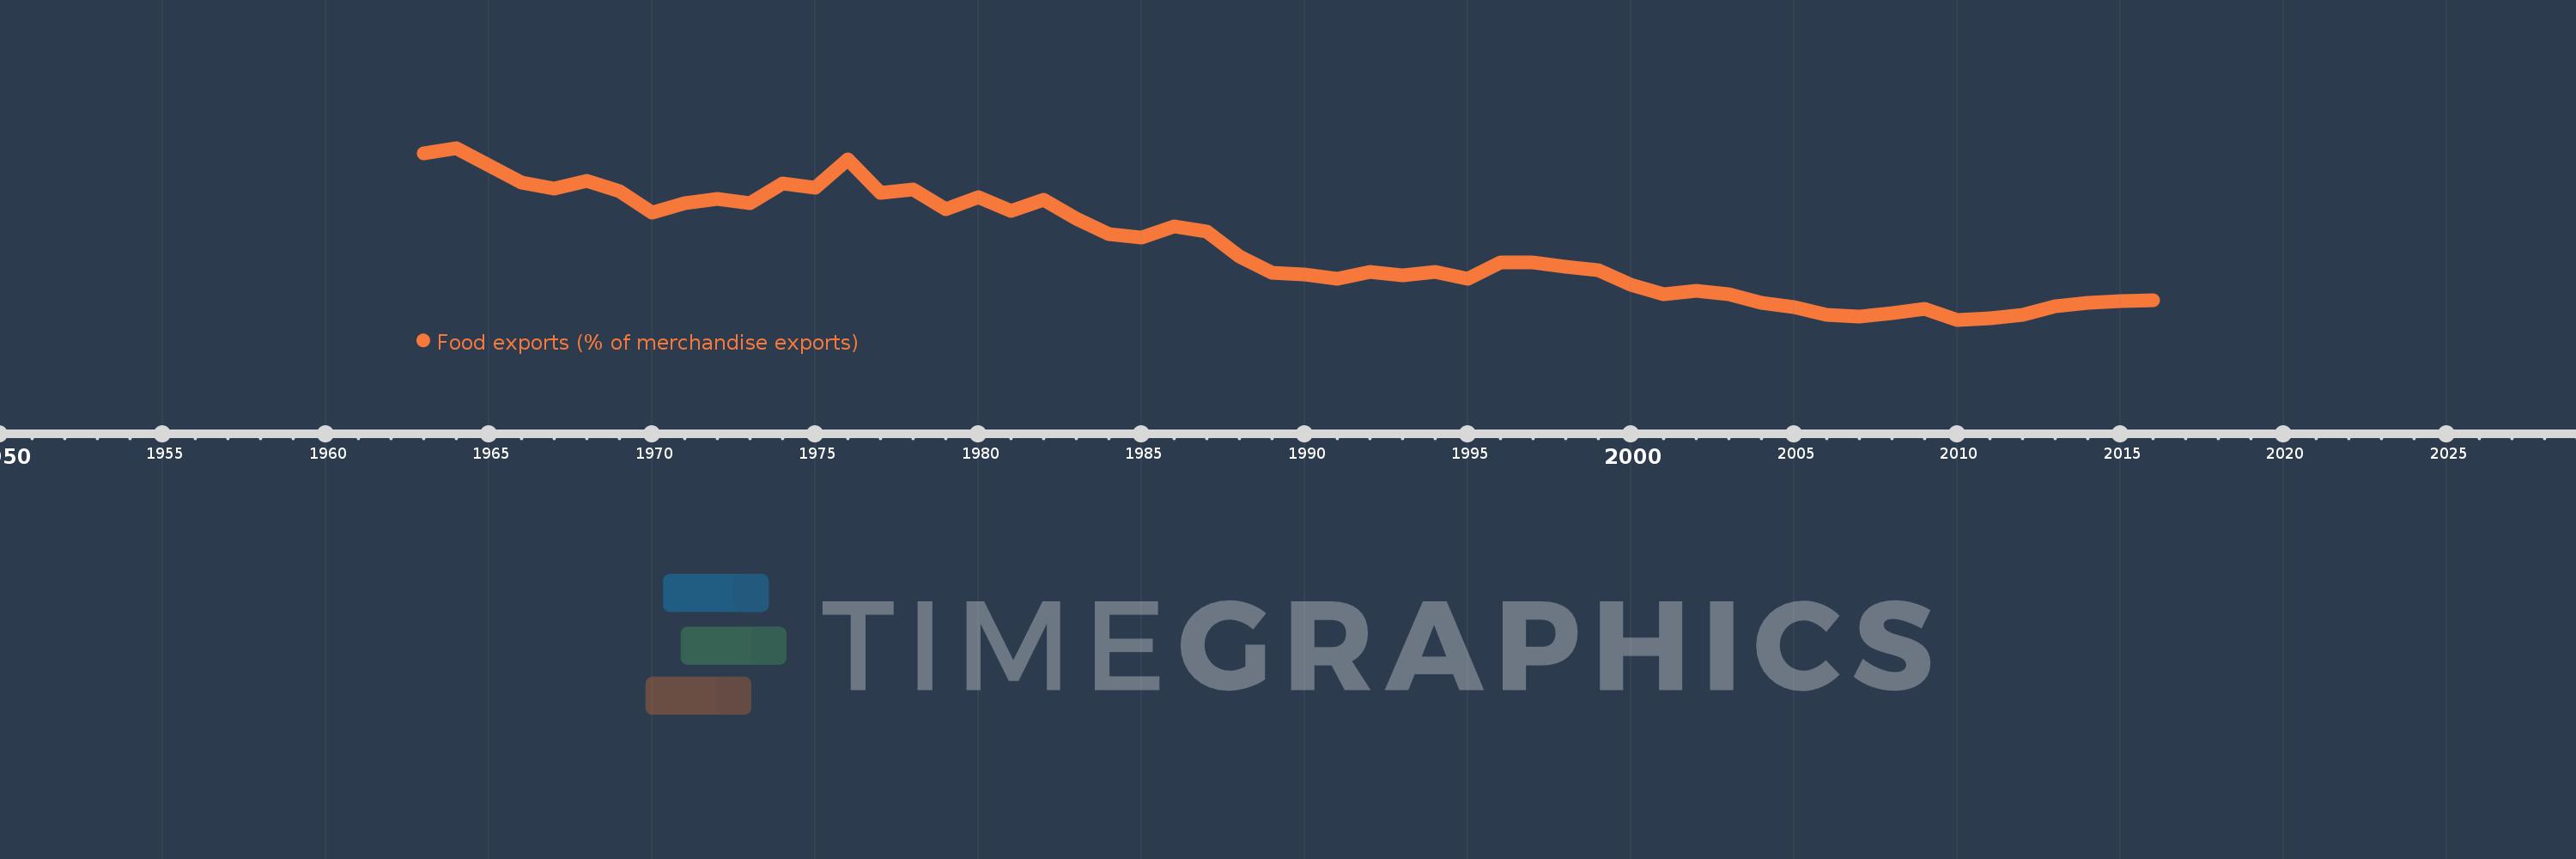
Food exports (% of merchandise exports)
2016,2015,2014,2013,2012,2011,2010,2009,2008,2007,2006,2005,2004,2003,2002,2001,2000,1999,1998,1997,1996,1995,1994,1993,1992,1991,1990,1989,1988,1987,1986,1985,1984,1983,1982,1981,1980,1979,1978,1977,1976,1975,1974,1973,1972,1971,1970,1969,1968,1967,1966,1965,1964,1963
Estas estadísticas en otros países:
AfghanistanAlbaniaAlgeriaAndorraAngolaAntigua and BarbudaArab WorldArgentinaArmeniaArubaAustraliaAustriaAzerbaijanBahamas, TheBahrainBangladeshBarbadosBelarusBelgiumBelizeBeninBermudaBhutanBoliviaBosnia and HerzegovinaBotswanaBrazilBrunei DarussalamBulgariaBurkina FasoBurundiCabo VerdeCambodiaCameroonCanadaCaribbean small statesCayman IslandsCentral African RepublicCentral Europe and the BalticsChadChileChinaColombiaComorosCongo, Dem. Rep.Congo, Rep.Costa RicaCote d'IvoireCroatiaCubaCyprusCzech RepublicDenmarkDjiboutiDominicaDominican RepublicEarly-demographic dividendEast Asia & PacificEast Asia & Pacific (excluding high income)East Asia & Pacific (IDA & IBRD countries)EcuadorEgypt, Arab Rep.El SalvadorEquatorial GuineaEritreaEstoniaEthiopiaEuro areaEurope & Central AsiaEurope & Central Asia (excluding high income)Europe & Central Asia (IDA & IBRD countries)European UnionFaroe IslandsFijiFinlandFragile and conflict affected situationsFranceFrench PolynesiaGabonGambia, TheGeorgiaGermanyGhanaGreeceGreenlandGrenadaGuatemalaGuineaGuinea-BissauGuyanaHaitiHeavily indebted poor countries (HIPC)High incomeHondurasHong Kong SAR, ChinaHungaryIBRD onlyIcelandIDA & IBRD totalIDA blendIDA onlyIDA totalIndiaIndonesiaIran, Islamic Rep.IraqIrelandIsraelItalyJamaicaJapanJordanKazakhstanKenyaKiribatiKorea, Rep.KuwaitKyrgyz RepublicLao PDRLate-demographic dividendLatin America & Caribbean Latin America & Caribbean (excluding high income)Latin America & the Caribbean (IDA & IBRD countries)LatviaLeast developed countries: UN classificationLebanonLesothoLiberiaLibyaLithuaniaLow & middle incomeLower middle incomeLuxembourgMacao SAR, ChinaMacedonia, FYRMadagascarMalawiMalaysiaMaldivesMaliMaltaMauritaniaMauritiusMexicoMiddle East & North AfricaMiddle East & North Africa (excluding high income)Middle East & North Africa (IDA & IBRD countries)Middle incomeMoldovaMongoliaMoroccoMozambiqueMyanmarNamibiaNepalNetherlandsNew CaledoniaNew ZealandNicaraguaNigerNigeriaNorth AmericaNorwayOECD membersOmanOther small statesPacific island small statesPakistanPalauPanamaPapua New GuineaParaguayPeruPhilippinesPolandPortugalPost-demographic dividendPre-demographic dividendQatarRomaniaRussian FederationRwandaSamoaSao Tome and PrincipeSaudi ArabiaSenegalSerbiaSeychellesSierra LeoneSingaporeSlovak RepublicSloveniaSmall statesSolomon IslandsSomaliaSouth AfricaSouth AsiaSouth Asia (IDA & IBRD)SpainSri LankaSt. Kitts and NevisSt. LuciaSt. Vincent and the GrenadinesSub-Saharan Africa Sub-Saharan Africa (excluding high income)Sub-Saharan Africa (IDA & IBRD countries)SudanSurinameSwazilandSwedenSwitzerlandSyrian Arab RepublicTajikistanTanzaniaThailandTimor-LesteTogoTongaTrinidad and TobagoTunisiaTurkeyTurkmenistanTurks and Caicos IslandsTuvaluUgandaUkraineUnited Arab EmiratesUnited KingdomUnited StatesUpper middle incomeUruguayVanuatuVenezuela, RBVietnamVirgin Islands (U.S.)WorldYemen, Rep.ZambiaZimbabwe línea de tiempo (timeline):
En esta escala de tiempo se presenta un gráfico de 1963 y 2016 de India. Los datos de 1962 están ausentes. El número de observaciones reales por fecha: 54.
Fuente (nombre):
Indicadores del desarrollo mundial
Fuente (organización):
World Bank staff estimates from the Comtrade database maintained by the United Nations Statistics Division.
Categorías:
Private Sector, Trade
Se ha actualizado:
23 abr 2017 año
Los indicadores de los cambios de valor en los últimos años
Mínimo:
7.983
1 ene 2010 año
Máximo:
39.865
1 ene 1964 año
A la fecha de observación
Valor
Cambio absoluto
El cambio con respecto al valor anterior
1 ene 1963 año
38.896
+38.896
0.0%
1 ene 1964 año
39.865
+0.969
2.49%
1 ene 1965 año
36.602
-3.262
-8.18%
1 ene 1966 año
33.413
-3.189
-8.71%
1 ene 1967 año
32.38
-1.033
-3.09%
1 ene 1968 año
33.685
+1.304
4.03%
1 ene 1969 año
31.916
-1.769
-5.25%
1 ene 1970 año
27.817
-4.099
-12.84%
1 ene 1971 año
29.675
+1.858
6.68%
1 ene 1972 año
30.42
+0.745
2.51%
1 ene 1973 año
29.683
-0.737
-2.42%
1 ene 1974 año
33.337
+3.654
12.31%
1 ene 1975 año
32.556
-0.78
-2.34%
1 ene 1976 año
37.73
+5.174
15.89%
1 ene 1977 año
31.599
-6.13
-16.25%
1 ene 1978 año
32.215
+0.616
1.95%
1 ene 1979 año
28.509
-3.706
-11.5%
1 ene 1980 año
30.804
+2.295
8.05%
1 ene 1981 año
28.167
-2.637
-8.56%
1 ene 1982 año
30.178
+2.011
7.14%
1 ene 1983 año
26.771
-3.407
-11.29%
1 ene 1984 año
23.916
-2.855
-10.66%
1 ene 1985 año
23.268
-0.648
-2.71%
1 ene 1986 año
25.346
+2.078
8.93%
1 ene 1987 año
24.411
-0.935
-3.69%
1 ene 1988 año
19.721
-4.69
-19.21%
1 ene 1989 año
16.667
-3.054
-15.49%
1 ene 1990 año
16.391
-0.276
-1.65%
1 ene 1991 año
15.578
-0.813
-4.96%
1 ene 1992 año
16.797
+1.22
7.83%
1 ene 1993 año
16.18
-0.617
-3.68%
1 ene 1994 año
16.794
+0.614
3.79%
1 ene 1995 año
15.527
-1.266
-7.54%
1 ene 1996 año
18.679
+3.152
20.3%
1 ene 1997 año
18.54
-0.139
-0.74%
1 ene 1998 año
17.762
-0.778
-4.2%
1 ene 1999 año
17.175
-0.587
-3.31%
1 ene 2000 año
14.493
-2.681
-15.61%
1 ene 2001 año
12.79
-1.703
-11.75%
1 ene 2002 año
13.282
+0.492
3.85%
1 ene 2003 año
12.732
-0.55
-4.14%
1 ene 2004 año
11.058
-1.675
-13.15%
1 ene 2005 año
10.388
-0.669
-6.05%
1 ene 2006 año
8.97
-1.418
-13.65%
1 ene 2007 año
8.556
-0.414
-4.61%
1 ene 2008 año
9.188
+0.632
7.38%
1 ene 2009 año
9.946
+0.758
8.25%
1 ene 2010 año
7.983
-1.963
-19.73%
1 ene 2011 año
8.258
+0.275
3.44%
1 ene 2012 año
8.968
+0.71
8.6%
1 ene 2013 año
10.543
+1.575
17.56%
1 ene 2014 año
11.195
+0.652
6.18%
1 ene 2015 año
11.418
+0.223
2.0%
1 ene 2016 año
11.553
+0.134
1.18%
Ranking de los países por los datos estadísticos actuales


Comentarios: