29
/es/
es
AIzaSyAYiBZKx7MnpbEhh9jyipgxe19OcubqV5w
April 1, 2024
118886
Denmark
DNK
true
2
1
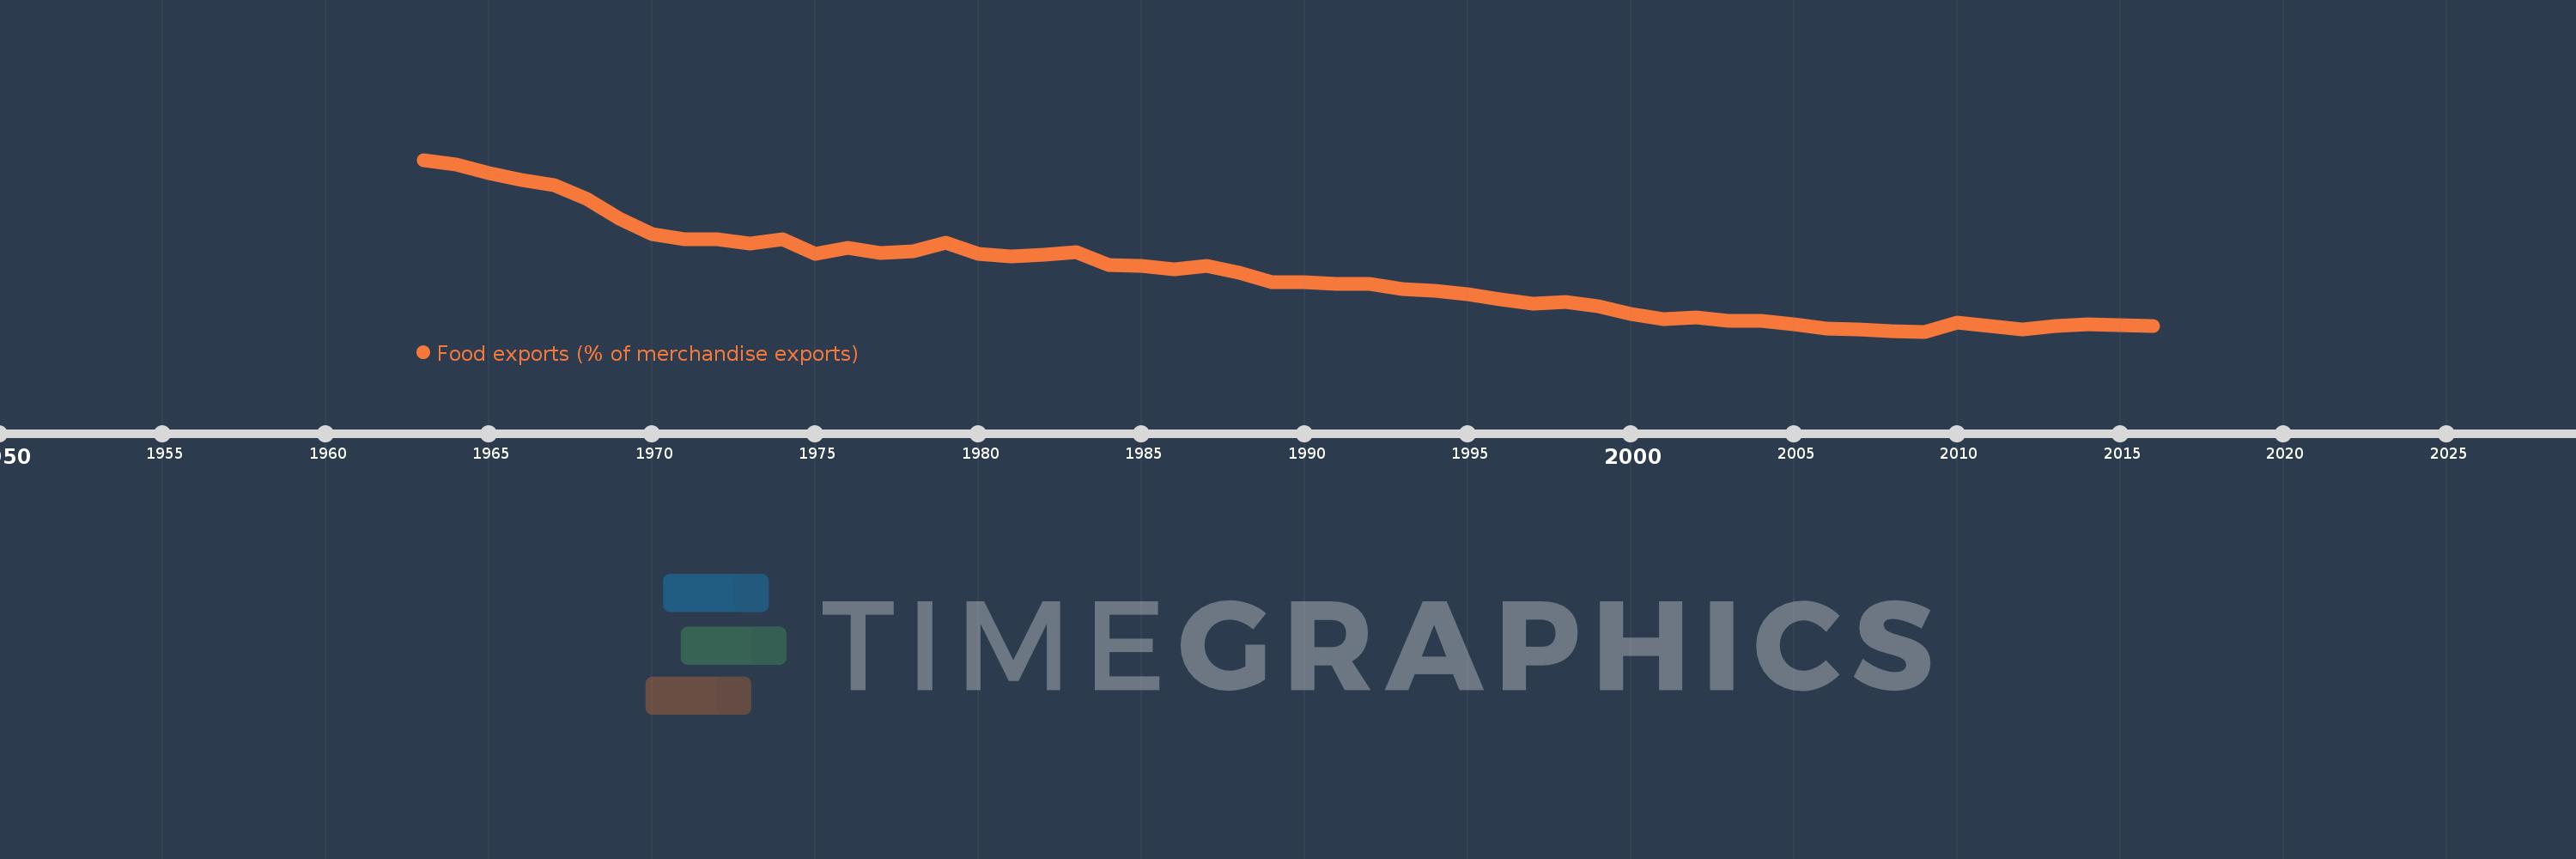
Food exports (% of merchandise exports)
2016,2015,2014,2013,2012,2011,2010,2009,2008,2007,2006,2005,2004,2003,2002,2001,2000,1999,1998,1997,1996,1995,1994,1993,1992,1991,1990,1989,1988,1987,1986,1985,1984,1983,1982,1981,1980,1979,1978,1977,1976,1975,1974,1973,1972,1971,1970,1969,1968,1967,1966,1965,1964,1963
Estas estadísticas en otros países:
AfghanistanAlbaniaAlgeriaAndorraAngolaAntigua and BarbudaArab WorldArgentinaArmeniaArubaAustraliaAustriaAzerbaijanBahamas, TheBahrainBangladeshBarbadosBelarusBelgiumBelizeBeninBermudaBhutanBoliviaBosnia and HerzegovinaBotswanaBrazilBrunei DarussalamBulgariaBurkina FasoBurundiCabo VerdeCambodiaCameroonCanadaCaribbean small statesCayman IslandsCentral African RepublicCentral Europe and the BalticsChadChileChinaColombiaComorosCongo, Dem. Rep.Congo, Rep.Costa RicaCote d'IvoireCroatiaCubaCyprusCzech RepublicDenmarkDjiboutiDominicaDominican RepublicEarly-demographic dividendEast Asia & PacificEast Asia & Pacific (excluding high income)East Asia & Pacific (IDA & IBRD countries)EcuadorEgypt, Arab Rep.El SalvadorEquatorial GuineaEritreaEstoniaEthiopiaEuro areaEurope & Central AsiaEurope & Central Asia (excluding high income)Europe & Central Asia (IDA & IBRD countries)European UnionFaroe IslandsFijiFinlandFragile and conflict affected situationsFranceFrench PolynesiaGabonGambia, TheGeorgiaGermanyGhanaGreeceGreenlandGrenadaGuatemalaGuineaGuinea-BissauGuyanaHaitiHeavily indebted poor countries (HIPC)High incomeHondurasHong Kong SAR, ChinaHungaryIBRD onlyIcelandIDA & IBRD totalIDA blendIDA onlyIDA totalIndiaIndonesiaIran, Islamic Rep.IraqIrelandIsraelItalyJamaicaJapanJordanKazakhstanKenyaKiribatiKorea, Rep.KuwaitKyrgyz RepublicLao PDRLate-demographic dividendLatin America & Caribbean Latin America & Caribbean (excluding high income)Latin America & the Caribbean (IDA & IBRD countries)LatviaLeast developed countries: UN classificationLebanonLesothoLiberiaLibyaLithuaniaLow & middle incomeLower middle incomeLuxembourgMacao SAR, ChinaMacedonia, FYRMadagascarMalawiMalaysiaMaldivesMaliMaltaMauritaniaMauritiusMexicoMiddle East & North AfricaMiddle East & North Africa (excluding high income)Middle East & North Africa (IDA & IBRD countries)Middle incomeMoldovaMongoliaMoroccoMozambiqueMyanmarNamibiaNepalNetherlandsNew CaledoniaNew ZealandNicaraguaNigerNigeriaNorth AmericaNorwayOECD membersOmanOther small statesPacific island small statesPakistanPalauPanamaPapua New GuineaParaguayPeruPhilippinesPolandPortugalPost-demographic dividendPre-demographic dividendQatarRomaniaRussian FederationRwandaSamoaSao Tome and PrincipeSaudi ArabiaSenegalSerbiaSeychellesSierra LeoneSingaporeSlovak RepublicSloveniaSmall statesSolomon IslandsSomaliaSouth AfricaSouth AsiaSouth Asia (IDA & IBRD)SpainSri LankaSt. Kitts and NevisSt. LuciaSt. Vincent and the GrenadinesSub-Saharan Africa Sub-Saharan Africa (excluding high income)Sub-Saharan Africa (IDA & IBRD countries)SudanSurinameSwazilandSwedenSwitzerlandSyrian Arab RepublicTajikistanTanzaniaThailandTimor-LesteTogoTongaTrinidad and TobagoTunisiaTurkeyTurkmenistanTurks and Caicos IslandsTuvaluUgandaUkraineUnited Arab EmiratesUnited KingdomUnited StatesUpper middle incomeUruguayVanuatuVenezuela, RBVietnamVirgin Islands (U.S.)WorldYemen, Rep.ZambiaZimbabwe línea de tiempo (timeline):
En esta escala de tiempo se presenta un gráfico de 1963 y 2016 de Denmark. Los datos de 1962 están ausentes. El número de observaciones reales por fecha: 54.
Fuente (nombre):
Indicadores del desarrollo mundial
Fuente (organización):
World Bank staff estimates from the Comtrade database maintained by the United Nations Statistics Division.
Categorías:
Private Sector, Trade
Se ha actualizado:
23 abr 2017 año
Los indicadores de los cambios de valor en los últimos años
Mínimo:
17.062
1 ene 2009 año
Máximo:
53.646
1 ene 1963 año
A la fecha de observación
Valor
Cambio absoluto
El cambio con respecto al valor anterior
1 ene 1963 año
53.646
+53.646
0.0%
1 ene 1964 año
52.729
-0.917
-1.71%
1 ene 1965 año
50.807
-1.922
-3.65%
1 ene 1966 año
49.297
-1.509
-2.97%
1 ene 1967 año
48.237
-1.061
-2.15%
1 ene 1968 año
45.332
-2.905
-6.02%
1 ene 1969 año
41.203
-4.129
-9.11%
1 ene 1970 año
37.751
-3.453
-8.38%
1 ene 1971 año
36.685
-1.066
-2.82%
1 ene 1972 año
36.697
+0.012
0.03%
1 ene 1973 año
35.725
-0.972
-2.65%
1 ene 1974 año
36.643
+0.918
2.57%
1 ene 1975 año
33.697
-2.946
-8.04%
1 ene 1976 año
34.932
+1.235
3.66%
1 ene 1977 año
33.845
-1.087
-3.11%
1 ene 1978 año
34.117
+0.272
0.8%
1 ene 1979 año
35.993
+1.877
5.5%
1 ene 1980 año
33.697
-2.297
-6.38%
1 ene 1981 año
33.142
-0.555
-1.65%
1 ene 1982 año
33.441
+0.3
0.9%
1 ene 1983 año
33.998
+0.557
1.66%
1 ene 1984 año
31.313
-2.685
-7.9%
1 ene 1985 año
31.114
-0.199
-0.64%
1 ene 1986 año
30.324
-0.79
-2.54%
1 ene 1987 año
31.016
+0.691
2.28%
1 ene 1988 año
29.571
-1.444
-4.66%
1 ene 1989 año
27.655
-1.916
-6.48%
1 ene 1990 año
27.587
-0.068
-0.25%
1 ene 1991 año
27.173
-0.415
-1.5%
1 ene 1992 año
27.224
+0.051
0.19%
1 ene 1993 año
26.109
-1.114
-4.09%
1 ene 1994 año
25.715
-0.395
-1.51%
1 ene 1995 año
25.099
-0.616
-2.39%
1 ene 1996 año
23.979
-1.12
-4.46%
1 ene 1997 año
22.954
-1.025
-4.28%
1 ene 1998 año
23.388
+0.434
1.89%
1 ene 1999 año
22.532
-0.856
-3.66%
1 ene 2000 año
20.759
-1.773
-7.87%
1 ene 2001 año
19.706
-1.053
-5.07%
1 ene 2002 año
20.147
+0.44
2.23%
1 ene 2003 año
19.378
-0.769
-3.82%
1 ene 2004 año
19.291
-0.087
-0.45%
1 ene 2005 año
18.59
-0.701
-3.63%
1 ene 2006 año
17.627
-0.963
-5.18%
1 ene 2007 año
17.519
-0.107
-0.61%
1 ene 2008 año
17.221
-0.298
-1.7%
1 ene 2009 año
17.062
-0.16
-0.93%
1 ene 2010 año
18.92
+1.858
10.89%
1 ene 2011 año
18.312
-0.608
-3.21%
1 ene 2012 año
17.61
-0.702
-3.83%
1 ene 2013 año
18.174
+0.564
3.2%
1 ene 2014 año
18.532
+0.358
1.97%
1 ene 2015 año
18.381
-0.151
-0.82%
1 ene 2016 año
18.247
-0.134
-0.73%
Ranking de los países por los datos estadísticos actuales


Comentarios: