29
/es/
es
AIzaSyAYiBZKx7MnpbEhh9jyipgxe19OcubqV5w
April 1, 2024
285874
Zambia
ZMB
true
2
1
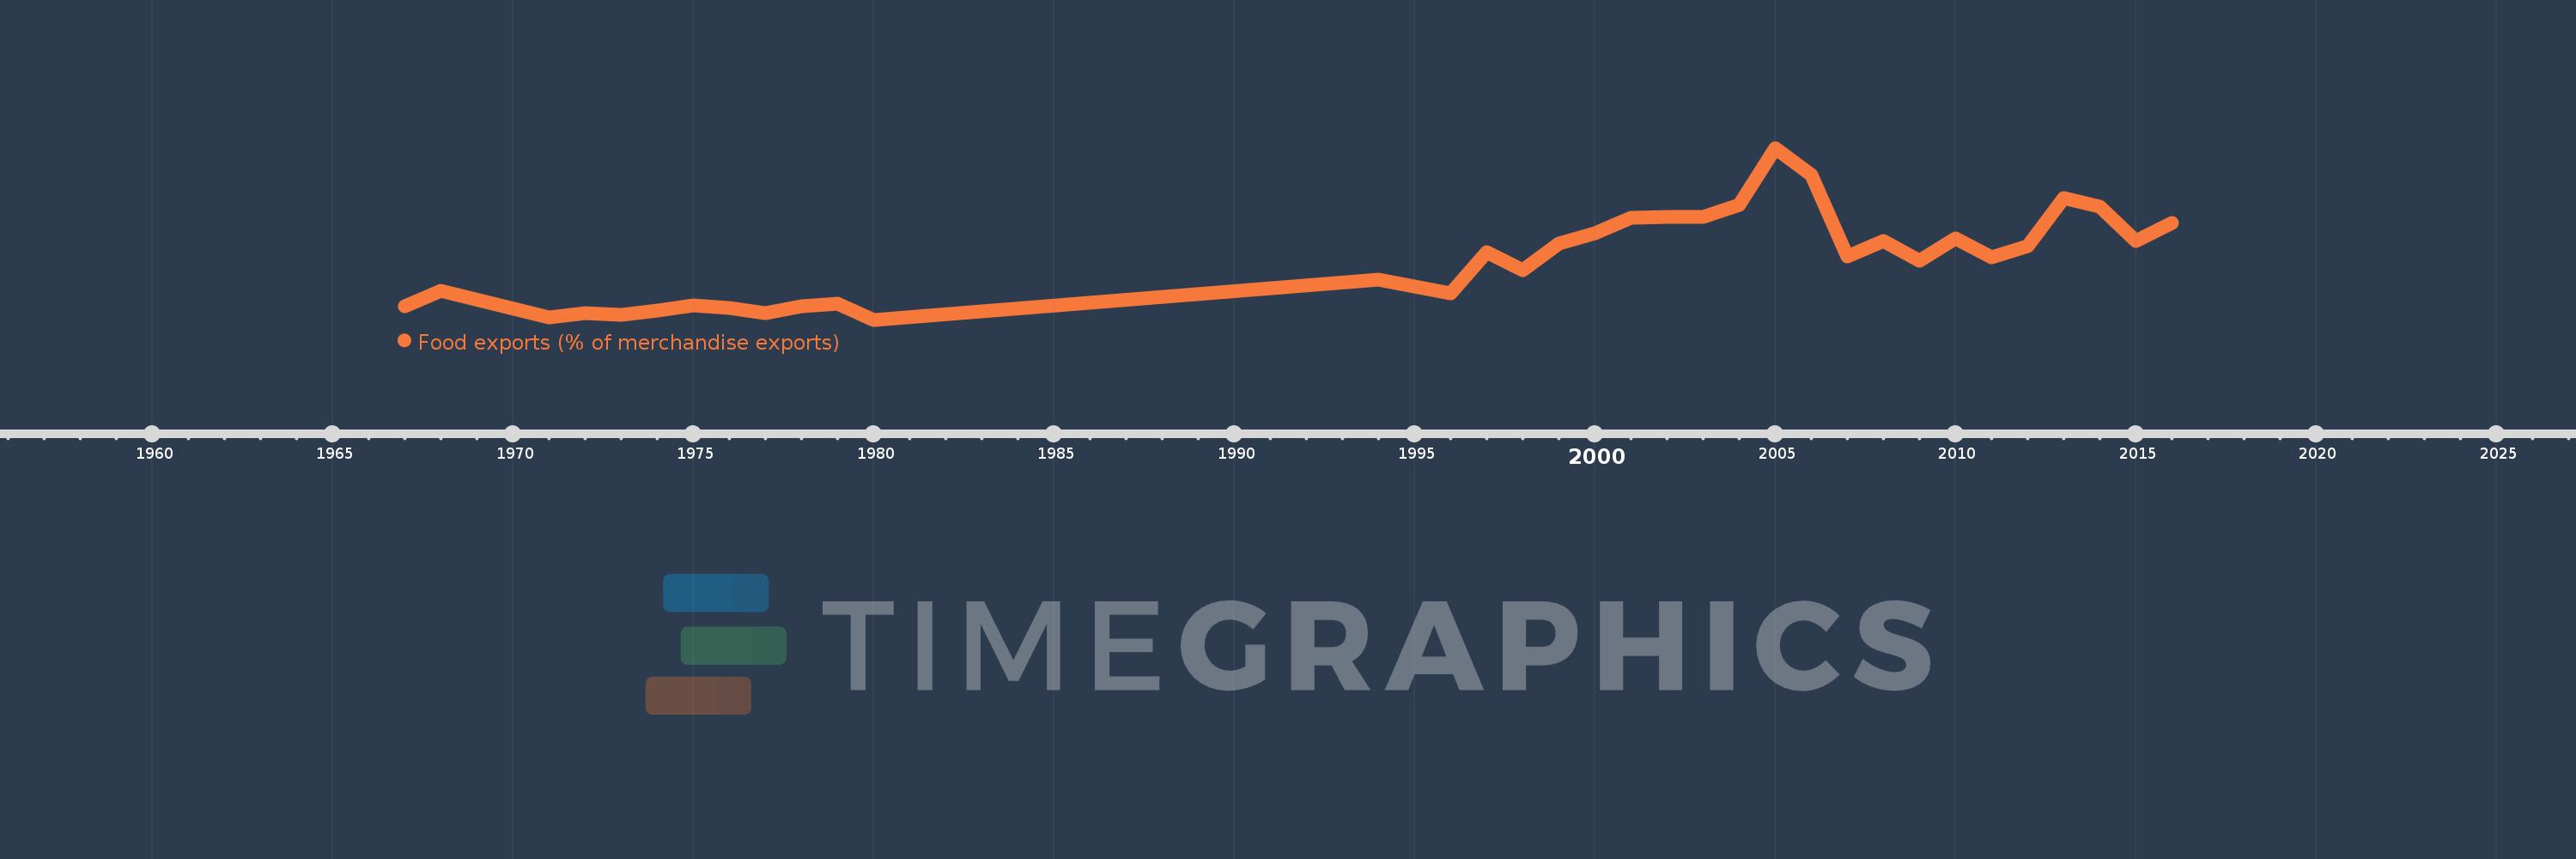
Food exports (% of merchandise exports)
2016,2015,2014,2013,2012,2011,2010,2009,2008,2007,2006,2005,2004,2003,2002,2001,2000,1999,1998,1997,1996,1994,1980,1979,1978,1977,1976,1975,1974,1973,1972,1971,1968,1967
Estas estadísticas en otros países:
AfghanistanAlbaniaAlgeriaAndorraAngolaAntigua and BarbudaArab WorldArgentinaArmeniaArubaAustraliaAustriaAzerbaijanBahamas, TheBahrainBangladeshBarbadosBelarusBelgiumBelizeBeninBermudaBhutanBoliviaBosnia and HerzegovinaBotswanaBrazilBrunei DarussalamBulgariaBurkina FasoBurundiCabo VerdeCambodiaCameroonCanadaCaribbean small statesCayman IslandsCentral African RepublicCentral Europe and the BalticsChadChileChinaColombiaComorosCongo, Dem. Rep.Congo, Rep.Costa RicaCote d'IvoireCroatiaCubaCyprusCzech RepublicDenmarkDjiboutiDominicaDominican RepublicEarly-demographic dividendEast Asia & PacificEast Asia & Pacific (excluding high income)East Asia & Pacific (IDA & IBRD countries)EcuadorEgypt, Arab Rep.El SalvadorEquatorial GuineaEritreaEstoniaEthiopiaEuro areaEurope & Central AsiaEurope & Central Asia (excluding high income)Europe & Central Asia (IDA & IBRD countries)European UnionFaroe IslandsFijiFinlandFragile and conflict affected situationsFranceFrench PolynesiaGabonGambia, TheGeorgiaGermanyGhanaGreeceGreenlandGrenadaGuatemalaGuineaGuinea-BissauGuyanaHaitiHeavily indebted poor countries (HIPC)High incomeHondurasHong Kong SAR, ChinaHungaryIBRD onlyIcelandIDA & IBRD totalIDA blendIDA onlyIDA totalIndiaIndonesiaIran, Islamic Rep.IraqIrelandIsraelItalyJamaicaJapanJordanKazakhstanKenyaKiribatiKorea, Rep.KuwaitKyrgyz RepublicLao PDRLate-demographic dividendLatin America & Caribbean Latin America & Caribbean (excluding high income)Latin America & the Caribbean (IDA & IBRD countries)LatviaLeast developed countries: UN classificationLebanonLesothoLiberiaLibyaLithuaniaLow & middle incomeLower middle incomeLuxembourgMacao SAR, ChinaMacedonia, FYRMadagascarMalawiMalaysiaMaldivesMaliMaltaMauritaniaMauritiusMexicoMiddle East & North AfricaMiddle East & North Africa (excluding high income)Middle East & North Africa (IDA & IBRD countries)Middle incomeMoldovaMongoliaMoroccoMozambiqueMyanmarNamibiaNepalNetherlandsNew CaledoniaNew ZealandNicaraguaNigerNigeriaNorth AmericaNorwayOECD membersOmanOther small statesPacific island small statesPakistanPalauPanamaPapua New GuineaParaguayPeruPhilippinesPolandPortugalPost-demographic dividendPre-demographic dividendQatarRomaniaRussian FederationRwandaSamoaSao Tome and PrincipeSaudi ArabiaSenegalSerbiaSeychellesSierra LeoneSingaporeSlovak RepublicSloveniaSmall statesSolomon IslandsSomaliaSouth AfricaSouth AsiaSouth Asia (IDA & IBRD)SpainSri LankaSt. Kitts and NevisSt. LuciaSt. Vincent and the GrenadinesSub-Saharan Africa Sub-Saharan Africa (excluding high income)Sub-Saharan Africa (IDA & IBRD countries)SudanSurinameSwazilandSwedenSwitzerlandSyrian Arab RepublicTajikistanTanzaniaThailandTimor-LesteTogoTongaTrinidad and TobagoTunisiaTurkeyTurkmenistanTurks and Caicos IslandsTuvaluUgandaUkraineUnited Arab EmiratesUnited KingdomUnited StatesUpper middle incomeUruguayVanuatuVenezuela, RBVietnamVirgin Islands (U.S.)WorldYemen, Rep.ZambiaZimbabwe línea de tiempo (timeline):
En esta escala de tiempo se presenta un gráfico de 1967 y 2016 de Zambia. Los datos de 1966 están ausentes. El número de observaciones reales por fecha: 34.
Fuente (nombre):
Indicadores del desarrollo mundial
Fuente (organización):
World Bank staff estimates from the Comtrade database maintained by the United Nations Statistics Division.
Categorías:
Private Sector, Trade
Se ha actualizado:
23 abr 2017 año
Los indicadores de los cambios de valor en los últimos años
Mínimo:
0.356
1 ene 1980 año
Máximo:
15.563
1 ene 2005 año
A la fecha de observación
Valor
Cambio absoluto
El cambio con respecto al valor anterior
1 ene 1967 año
1.563
+1.563
0.0%
1 ene 1968 año
2.881
+1.318
84.33%
1 ene 1971 año
0.596
-2.285
-79.31%
1 ene 1972 año
0.975
+0.379
63.62%
1 ene 1973 año
0.764
-0.211
-21.67%
1 ene 1974 año
1.2
+0.436
57.05%
1 ene 1975 año
1.601
+0.401
33.45%
1 ene 1976 año
1.417
-0.184
-11.47%
1 ene 1977 año
0.919
-0.499
-35.17%
1 ene 1978 año
1.532
+0.613
66.71%
1 ene 1979 año
1.812
+0.28
18.29%
1 ene 1980 año
0.356
-1.456
-80.34%
1 ene 1994 año
3.911
+3.555
998.08%
1 ene 1996 año
2.678
-1.233
-31.53%
1 ene 1997 año
6.373
+3.695
138.0%
1 ene 1998 año
4.757
-1.616
-25.36%
1 ene 1999 año
7.126
+2.37
49.82%
1 ene 2000 año
8.011
+0.885
12.41%
1 ene 2001 año
9.394
+1.383
17.26%
1 ene 2002 año
9.469
+0.075
0.8%
1 ene 2003 año
9.482
+0.013
0.13%
1 ene 2004 año
10.516
+1.034
10.91%
1 ene 2005 año
15.563
+5.047
48.0%
1 ene 2006 año
13.206
-2.357
-15.14%
1 ene 2007 año
5.996
-7.211
-54.6%
1 ene 2008 año
7.361
+1.365
22.77%
1 ene 2009 año
5.588
-1.772
-24.08%
1 ene 2010 año
7.535
+1.946
34.82%
1 ene 2011 año
5.903
-1.631
-21.65%
1 ene 2012 año
6.893
+0.989
16.76%
1 ene 2013 año
11.15
+4.257
61.76%
1 ene 2014 año
10.356
-0.793
-7.12%
1 ene 2015 año
7.357
-3.0
-28.97%
1 ene 2016 año
8.893
+1.536
20.88%
Ranking de los países por los datos estadísticos actuales


Comentarios: