29
/es/
es
AIzaSyAYiBZKx7MnpbEhh9jyipgxe19OcubqV5w
April 1, 2024
265749
Tonga
TON
true
2
1
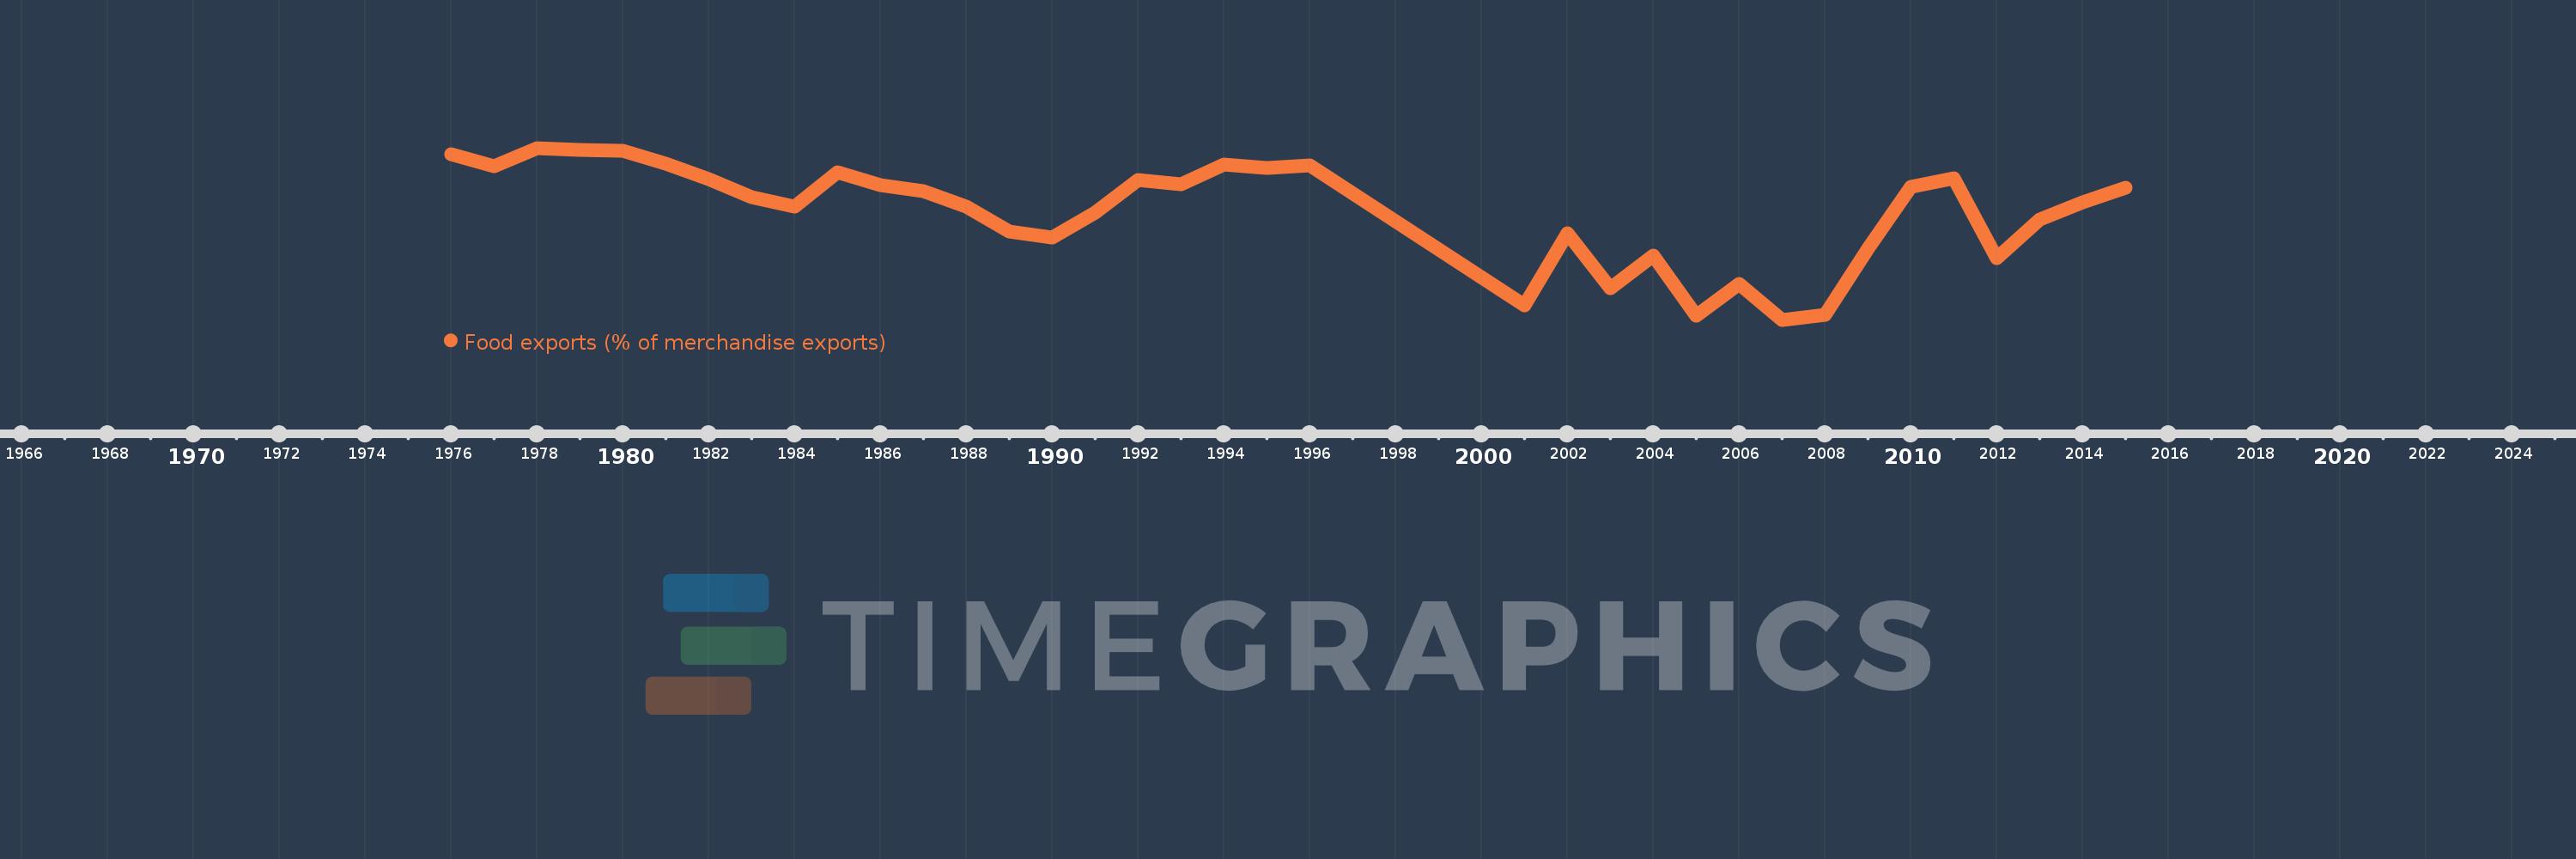
Food exports (% of merchandise exports)
2015,2014,2013,2012,2011,2010,2009,2008,2007,2006,2005,2004,2003,2002,2001,1996,1995,1994,1993,1992,1991,1990,1989,1988,1987,1986,1985,1984,1983,1982,1981,1980,1979,1978,1977,1976
Estas estadísticas en otros países:
AfghanistanAlbaniaAlgeriaAndorraAngolaAntigua and BarbudaArab WorldArgentinaArmeniaArubaAustraliaAustriaAzerbaijanBahamas, TheBahrainBangladeshBarbadosBelarusBelgiumBelizeBeninBermudaBhutanBoliviaBosnia and HerzegovinaBotswanaBrazilBrunei DarussalamBulgariaBurkina FasoBurundiCabo VerdeCambodiaCameroonCanadaCaribbean small statesCayman IslandsCentral African RepublicCentral Europe and the BalticsChadChileChinaColombiaComorosCongo, Dem. Rep.Congo, Rep.Costa RicaCote d'IvoireCroatiaCubaCyprusCzech RepublicDenmarkDjiboutiDominicaDominican RepublicEarly-demographic dividendEast Asia & PacificEast Asia & Pacific (excluding high income)East Asia & Pacific (IDA & IBRD countries)EcuadorEgypt, Arab Rep.El SalvadorEquatorial GuineaEritreaEstoniaEthiopiaEuro areaEurope & Central AsiaEurope & Central Asia (excluding high income)Europe & Central Asia (IDA & IBRD countries)European UnionFaroe IslandsFijiFinlandFragile and conflict affected situationsFranceFrench PolynesiaGabonGambia, TheGeorgiaGermanyGhanaGreeceGreenlandGrenadaGuatemalaGuineaGuinea-BissauGuyanaHaitiHeavily indebted poor countries (HIPC)High incomeHondurasHong Kong SAR, ChinaHungaryIBRD onlyIcelandIDA & IBRD totalIDA blendIDA onlyIDA totalIndiaIndonesiaIran, Islamic Rep.IraqIrelandIsraelItalyJamaicaJapanJordanKazakhstanKenyaKiribatiKorea, Rep.KuwaitKyrgyz RepublicLao PDRLate-demographic dividendLatin America & Caribbean Latin America & Caribbean (excluding high income)Latin America & the Caribbean (IDA & IBRD countries)LatviaLeast developed countries: UN classificationLebanonLesothoLiberiaLibyaLithuaniaLow & middle incomeLower middle incomeLuxembourgMacao SAR, ChinaMacedonia, FYRMadagascarMalawiMalaysiaMaldivesMaliMaltaMauritaniaMauritiusMexicoMiddle East & North AfricaMiddle East & North Africa (excluding high income)Middle East & North Africa (IDA & IBRD countries)Middle incomeMoldovaMongoliaMoroccoMozambiqueMyanmarNamibiaNepalNetherlandsNew CaledoniaNew ZealandNicaraguaNigerNigeriaNorth AmericaNorwayOECD membersOmanOther small statesPacific island small statesPakistanPalauPanamaPapua New GuineaParaguayPeruPhilippinesPolandPortugalPost-demographic dividendPre-demographic dividendQatarRomaniaRussian FederationRwandaSamoaSao Tome and PrincipeSaudi ArabiaSenegalSerbiaSeychellesSierra LeoneSingaporeSlovak RepublicSloveniaSmall statesSolomon IslandsSomaliaSouth AfricaSouth AsiaSouth Asia (IDA & IBRD)SpainSri LankaSt. Kitts and NevisSt. LuciaSt. Vincent and the GrenadinesSub-Saharan Africa Sub-Saharan Africa (excluding high income)Sub-Saharan Africa (IDA & IBRD countries)SudanSurinameSwazilandSwedenSwitzerlandSyrian Arab RepublicTajikistanTanzaniaThailandTimor-LesteTogoTongaTrinidad and TobagoTunisiaTurkeyTurkmenistanTurks and Caicos IslandsTuvaluUgandaUkraineUnited Arab EmiratesUnited KingdomUnited StatesUpper middle incomeUruguayVanuatuVenezuela, RBVietnamVirgin Islands (U.S.)WorldYemen, Rep.ZambiaZimbabwe línea de tiempo (timeline):
En esta escala de tiempo se presenta un gráfico de 1976 y 2015 de Tonga. Los datos de 1975 están ausentes. El número de observaciones reales por fecha: 36.
Fuente (nombre):
Indicadores del desarrollo mundial
Fuente (organización):
World Bank staff estimates from the Comtrade database maintained by the United Nations Statistics Division.
Categorías:
Private Sector, Trade
Se ha actualizado:
23 abr 2017 año
Los indicadores de los cambios de valor en los últimos años
Mínimo:
45.576
1 ene 2007 año
Máximo:
97.745
1 ene 1978 año
A la fecha de observación
Valor
Cambio absoluto
El cambio con respecto al valor anterior
1 ene 1976 año
95.894
+95.894
0.0%
1 ene 1977 año
92.205
-3.688
-3.85%
1 ene 1978 año
97.745
+5.54
6.01%
1 ene 1979 año
97.236
-0.509
-0.52%
1 ene 1980 año
96.787
-0.45
-0.46%
1 ene 1981 año
93.088
-3.699
-3.82%
1 ene 1982 año
88.198
-4.89
-5.25%
1 ene 1983 año
82.718
-5.48
-6.21%
1 ene 1984 año
79.958
-2.76
-3.34%
1 ene 1985 año
90.431
+10.473
13.1%
1 ene 1986 año
86.321
-4.11
-4.54%
1 ene 1987 año
84.655
-1.666
-1.93%
1 ene 1988 año
79.938
-4.717
-5.57%
1 ene 1989 año
72.43
-7.508
-9.39%
1 ene 1990 año
70.562
-1.868
-2.58%
1 ene 1991 año
78.221
+7.66
10.86%
1 ene 1992 año
87.899
+9.678
12.37%
1 ene 1993 año
86.706
-1.193
-1.36%
1 ene 1994 año
92.673
+5.967
6.88%
1 ene 1995 año
91.737
-0.935
-1.01%
1 ene 1996 año
92.538
+0.801
0.87%
1 ene 2001 año
49.869
-42.67
-46.11%
1 ene 2002 año
71.76
+21.891
43.9%
1 ene 2003 año
55.253
-16.507
-23.0%
1 ene 2004 año
65.117
+9.864
17.85%
1 ene 2005 año
46.892
-18.225
-27.99%
1 ene 2006 año
56.453
+9.561
20.39%
1 ene 2007 año
45.576
-10.877
-19.27%
1 ene 2008 año
47.0
+1.425
3.13%
1 ene 2009 año
67.277
+20.277
43.14%
1 ene 2010 año
85.949
+18.672
27.75%
1 ene 2011 año
88.58
+2.631
3.06%
1 ene 2012 año
64.177
-24.403
-27.55%
1 ene 2013 año
75.962
+11.785
18.36%
1 ene 2014 año
81.172
+5.21
6.86%
1 ene 2015 año
85.673
+4.501
5.55%
Ranking de los países por los datos estadísticos actuales


Comentarios: