29
/es/
es
AIzaSyAYiBZKx7MnpbEhh9jyipgxe19OcubqV5w
April 1, 2024
286015
Zambia
ZMB
true
2
1
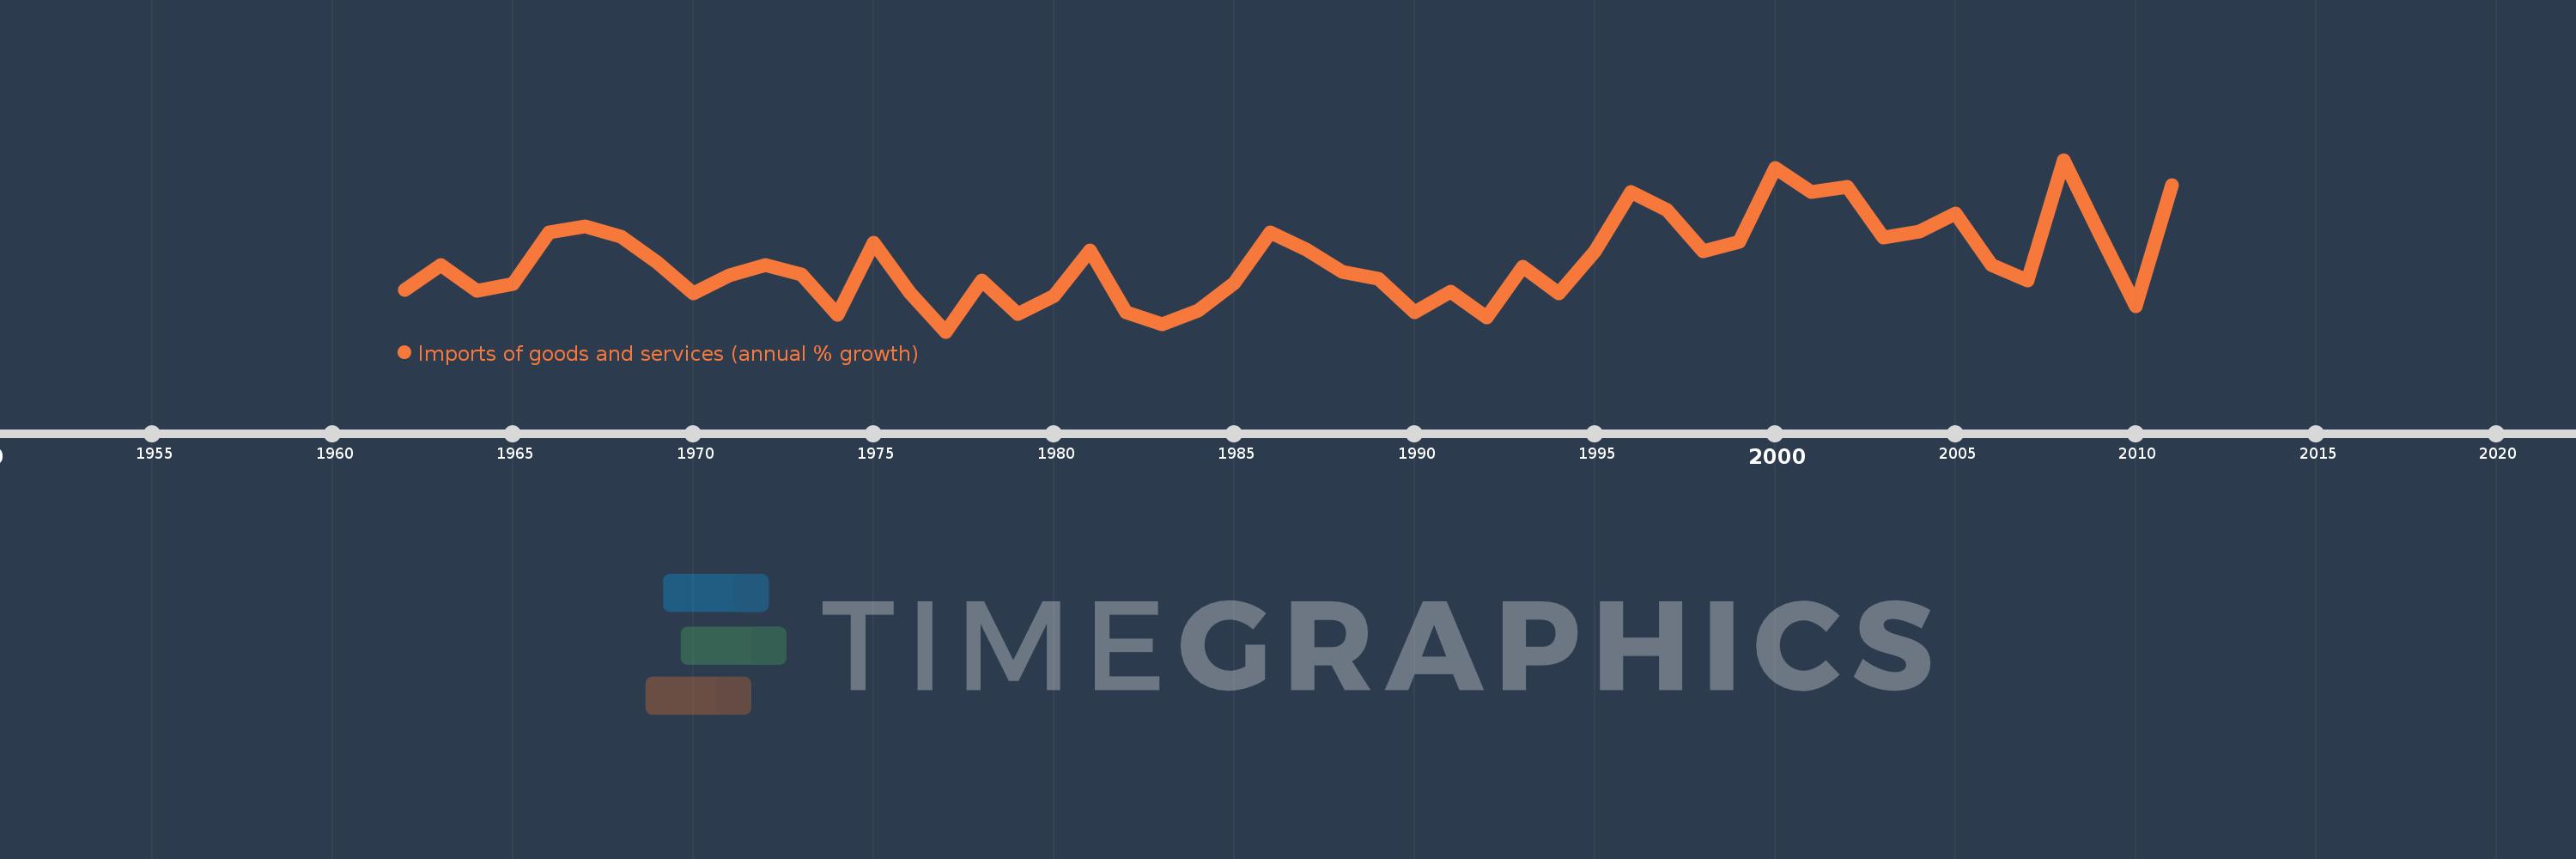
Imports of goods and services (annual % growth)
2011,2010,2009,2008,2007,2006,2005,2004,2003,2002,2001,2000,1999,1998,1997,1996,1995,1994,1993,1992,1991,1990,1989,1988,1987,1986,1985,1984,1983,1982,1981,1980,1979,1978,1977,1976,1975,1974,1973,1972,1971,1970,1969,1968,1967,1966,1965,1964,1963,1962
Estas estadísticas en otros países:
AlbaniaAlgeriaAngolaAntigua and BarbudaArab WorldArgentinaArmeniaAustraliaAustriaAzerbaijanBahamas, TheBahrainBangladeshBarbadosBelarusBelgiumBelizeBeninBhutanBoliviaBosnia and HerzegovinaBotswanaBrazilBrunei DarussalamBulgariaBurkina FasoBurundiCabo VerdeCambodiaCameroonCanadaCaribbean small statesCentral Europe and the BalticsChadChileColombiaComorosCongo, Dem. Rep.Congo, Rep.Costa RicaCote d'IvoireCroatiaCubaCyprusCzech RepublicDenmarkDjiboutiDominican RepublicEarly-demographic dividendEast Asia & PacificEcuadorEgypt, Arab Rep.El SalvadorEquatorial GuineaEritreaEstoniaEthiopiaEuro areaEurope & Central AsiaEurope & Central Asia (excluding high income)Europe & Central Asia (IDA & IBRD countries)European UnionFijiFinlandFranceGabonGambia, TheGeorgiaGermanyGhanaGreeceGuatemalaGuineaGuinea-BissauHaitiHeavily indebted poor countries (HIPC)High incomeHondurasHong Kong SAR, ChinaHungaryIBRD onlyIcelandIDA & IBRD totalIDA blendIDA onlyIDA totalIndiaIndonesiaIran, Islamic Rep.IrelandIsraelItalyJamaicaJapanJordanKazakhstanKenyaKorea, Rep.KosovoKuwaitKyrgyz RepublicLao PDRLatin America & Caribbean Latin America & Caribbean (excluding high income)Latin America & the Caribbean (IDA & IBRD countries)LatviaLeast developed countries: UN classificationLebanonLiberiaLibyaLithuaniaLow & middle incomeLow incomeLower middle incomeLuxembourgMacao SAR, ChinaMacedonia, FYRMadagascarMalawiMalaysiaMaliMaltaMauritaniaMauritiusMexicoMiddle East & North AfricaMiddle East & North Africa (excluding high income)Middle East & North Africa (IDA & IBRD countries)Middle incomeMoldovaMongoliaMontenegroMoroccoMozambiqueMyanmarNamibiaNepalNetherlandsNew ZealandNicaraguaNigerNigeriaNorth AmericaNorwayOECD membersOmanOther small statesPakistanPanamaPapua New GuineaParaguayPeruPhilippinesPolandPortugalPost-demographic dividendPre-demographic dividendPuerto RicoQatarRomaniaRussian FederationRwandaSamoaSaudi ArabiaSenegalSerbiaSeychellesSierra LeoneSingaporeSlovak RepublicSloveniaSmall statesSomaliaSouth AfricaSouth AsiaSouth Asia (IDA & IBRD)South SudanSpainSri LankaSub-Saharan Africa Sub-Saharan Africa (excluding high income)Sub-Saharan Africa (IDA & IBRD countries)SudanSurinameSwazilandSwedenSwitzerlandSyrian Arab RepublicTajikistanTanzaniaThailandTimor-LesteTogoTrinidad and TobagoTunisiaTurkeyTurkmenistanUgandaUkraineUnited Arab EmiratesUnited KingdomUnited StatesUruguayUzbekistanVanuatuVenezuela, RBVietnamWest Bank and GazaWorldZambiaZimbabwe línea de tiempo (timeline):
En esta escala de tiempo se presenta un gráfico de 1962 y 2011 de Zambia. Los datos de 1961 están ausentes. El número de observaciones reales por fecha: 50.
Fuente (nombre):
Indicadores del desarrollo mundial
Fuente (organización):
World Bank national accounts data, and OECD National Accounts data files.
Categorías:
Economy & Growth, Trade
Se ha actualizado:
23 abr 2017 año
Los indicadores de los cambios de valor en los últimos años
Mínimo:
-25.389
1 ene 1977 año
Máximo:
55.917
1 ene 2008 año
A la fecha de observación
Valor
Cambio absoluto
El cambio con respecto al valor anterior
1 ene 1962 año
-5.873
-5.873
0.0%
1 ene 1963 año
6.164
+12.037
-204.95%
1 ene 1964 año
-6.091
-12.255
-198.82%
1 ene 1965 año
-2.795
+3.296
-54.11%
1 ene 1966 año
21.581
+24.377
-872.12%
1 ene 1967 año
24.46
+2.879
13.34%
1 ene 1968 año
19.725
-4.735
-19.36%
1 ene 1969 año
7.289
-12.436
-63.05%
1 ene 1970 año
-7.155
-14.444
-198.17%
1 ene 1971 año
1.204
+8.359
-116.82%
1 ene 1972 año
5.972
+4.769
396.18%
1 ene 1973 año
1.607
-4.366
-73.1%
1 ene 1974 año
-17.332
-18.938
-1.18 mil%
1 ene 1975 año
16.601
+33.933
-195.78%
1 ene 1976 año
-6.843
-23.444
-141.22%
1 ene 1977 año
-25.389
-18.547
271.05%
1 ene 1978 año
-1.21
+24.18
-95.24%
1 ene 1979 año
-17.205
-15.995
1.32 mil%
1 ene 1980 año
-8.715
+8.49
-49.34%
1 ene 1981 año
12.851
+21.567
-247.46%
1 ene 1982 año
-16.047
-28.899
-224.87%
1 ene 1983 año
-21.965
-5.918
36.88%
1 ene 1984 año
-15.621
+6.344
-28.88%
1 ene 1985 año
-2.47
+13.151
-84.19%
1 ene 1986 año
21.462
+23.932
-968.9%
1 ene 1987 año
13.263
-8.199
-38.2%
1 ene 1988 año
2.752
-10.511
-79.25%
1 ene 1989 año
-0.185
-2.937
-106.71%
1 ene 1990 año
-16.229
-16.044
8.68 mil%
1 ene 1991 año
-6.384
+9.845
-60.66%
1 ene 1992 año
-18.759
-12.375
193.85%
1 ene 1993 año
5.228
+23.987
-127.87%
1 ene 1994 año
-7.397
-12.625
-241.49%
1 ene 1995 año
12.707
+20.104
-271.78%
1 ene 1996 año
40.634
+27.927
219.79%
1 ene 1997 año
32.132
-8.502
-20.92%
1 ene 1998 año
12.668
-19.464
-60.58%
1 ene 1999 año
17.053
+4.386
34.62%
1 ene 2000 año
52.12
+35.067
205.63%
1 ene 2001 año
40.677
-11.444
-21.96%
1 ene 2002 año
43.198
+2.522
6.2%
1 ene 2003 año
19.17
-24.029
-55.62%
1 ene 2004 año
21.934
+2.764
14.42%
1 ene 2005 año
30.389
+8.455
38.55%
1 ene 2006 año
6.016
-24.373
-80.2%
1 ene 2007 año
-1.154
-7.171
-119.19%
1 ene 2008 año
55.917
+57.071
-4.94 mil%
1 ene 2009 año
20.809
-35.108
-62.79%
1 ene 2010 año
-13.453
-34.261
-164.65%
1 ene 2011 año
43.937
+57.389
-426.6%
Ranking de los países por los datos estadísticos actuales


Comentarios: