29
/es/
es
AIzaSyAYiBZKx7MnpbEhh9jyipgxe19OcubqV5w
April 1, 2024
107374
Colombia
COL
true
2
1
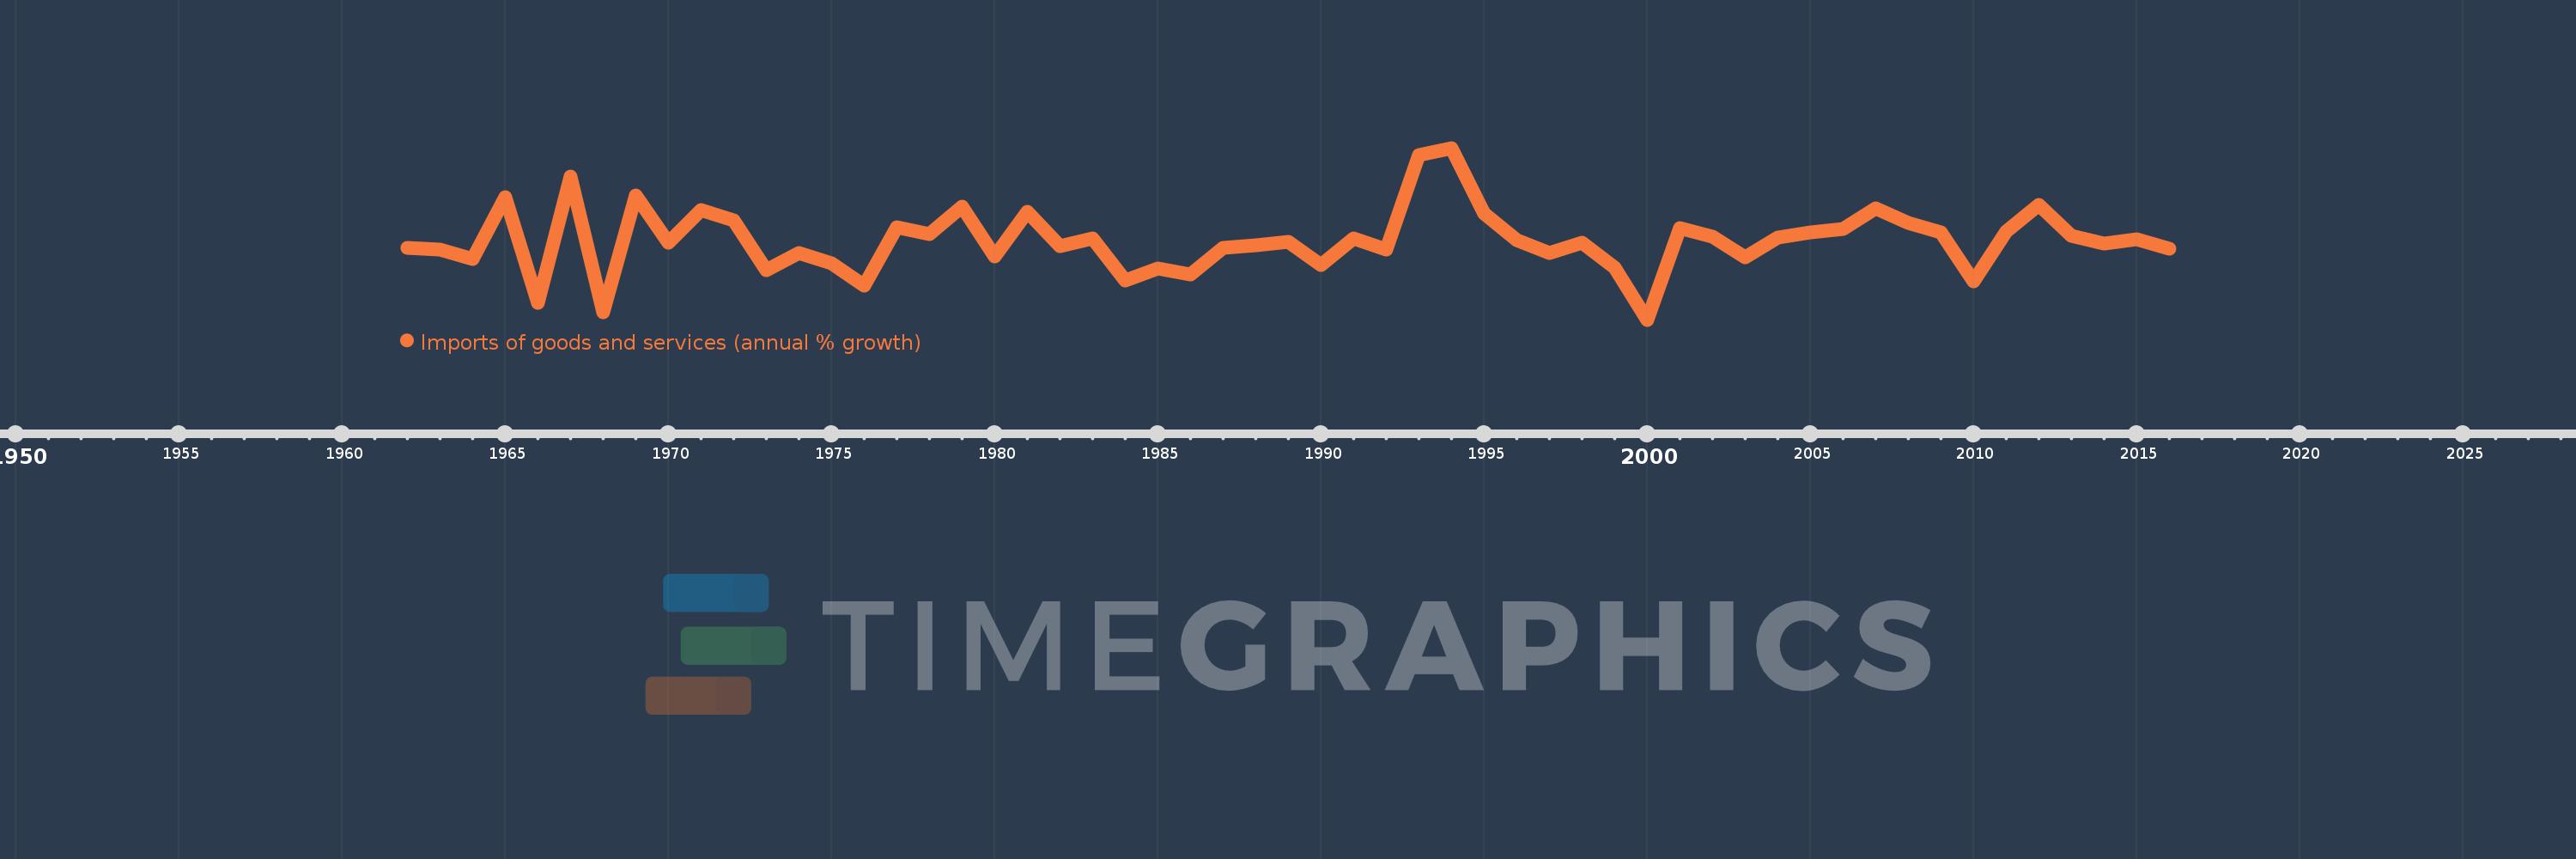
Imports of goods and services (annual % growth)
2016,2015,2014,2013,2012,2011,2010,2009,2008,2007,2006,2005,2004,2003,2002,2001,2000,1999,1998,1997,1996,1995,1994,1993,1992,1991,1990,1989,1988,1987,1986,1985,1984,1983,1982,1981,1980,1979,1978,1977,1976,1975,1974,1973,1972,1971,1970,1969,1968,1967,1966,1965,1964,1963,1962
Estas estadísticas en otros países:
AlbaniaAlgeriaAngolaAntigua and BarbudaArab WorldArgentinaArmeniaAustraliaAustriaAzerbaijanBahamas, TheBahrainBangladeshBarbadosBelarusBelgiumBelizeBeninBhutanBoliviaBosnia and HerzegovinaBotswanaBrazilBrunei DarussalamBulgariaBurkina FasoBurundiCabo VerdeCambodiaCameroonCanadaCaribbean small statesCentral Europe and the BalticsChadChileColombiaComorosCongo, Dem. Rep.Congo, Rep.Costa RicaCote d'IvoireCroatiaCubaCyprusCzech RepublicDenmarkDjiboutiDominican RepublicEarly-demographic dividendEast Asia & PacificEcuadorEgypt, Arab Rep.El SalvadorEquatorial GuineaEritreaEstoniaEthiopiaEuro areaEurope & Central AsiaEurope & Central Asia (excluding high income)Europe & Central Asia (IDA & IBRD countries)European UnionFijiFinlandFranceGabonGambia, TheGeorgiaGermanyGhanaGreeceGuatemalaGuineaGuinea-BissauHaitiHeavily indebted poor countries (HIPC)High incomeHondurasHong Kong SAR, ChinaHungaryIBRD onlyIcelandIDA & IBRD totalIDA blendIDA onlyIDA totalIndiaIndonesiaIran, Islamic Rep.IrelandIsraelItalyJamaicaJapanJordanKazakhstanKenyaKorea, Rep.KosovoKuwaitKyrgyz RepublicLao PDRLatin America & Caribbean Latin America & Caribbean (excluding high income)Latin America & the Caribbean (IDA & IBRD countries)LatviaLeast developed countries: UN classificationLebanonLiberiaLibyaLithuaniaLow & middle incomeLow incomeLower middle incomeLuxembourgMacao SAR, ChinaMacedonia, FYRMadagascarMalawiMalaysiaMaliMaltaMauritaniaMauritiusMexicoMiddle East & North AfricaMiddle East & North Africa (excluding high income)Middle East & North Africa (IDA & IBRD countries)Middle incomeMoldovaMongoliaMontenegroMoroccoMozambiqueMyanmarNamibiaNepalNetherlandsNew ZealandNicaraguaNigerNigeriaNorth AmericaNorwayOECD membersOmanOther small statesPakistanPanamaPapua New GuineaParaguayPeruPhilippinesPolandPortugalPost-demographic dividendPre-demographic dividendPuerto RicoQatarRomaniaRussian FederationRwandaSamoaSaudi ArabiaSenegalSerbiaSeychellesSierra LeoneSingaporeSlovak RepublicSloveniaSmall statesSomaliaSouth AfricaSouth AsiaSouth Asia (IDA & IBRD)South SudanSpainSri LankaSub-Saharan Africa Sub-Saharan Africa (excluding high income)Sub-Saharan Africa (IDA & IBRD countries)SudanSurinameSwazilandSwedenSwitzerlandSyrian Arab RepublicTajikistanTanzaniaThailandTimor-LesteTogoTrinidad and TobagoTunisiaTurkeyTurkmenistanUgandaUkraineUnited Arab EmiratesUnited KingdomUnited StatesUruguayUzbekistanVanuatuVenezuela, RBVietnamWest Bank and GazaWorldZambiaZimbabwe línea de tiempo (timeline):
En esta escala de tiempo se presenta un gráfico de 1962 y 2016 de Colombia. Los datos de 1961 están ausentes. El número de observaciones reales por fecha: 55.
Fuente (nombre):
Indicadores del desarrollo mundial
Fuente (organización):
World Bank national accounts data, and OECD National Accounts data files.
Categorías:
Economy & Growth, Trade
Se ha actualizado:
23 abr 2017 año
Los indicadores de los cambios de valor en los últimos años
Mínimo:
-24.681
1 ene 2000 año
Máximo:
44.311
1 ene 1994 año
A la fecha de observación
Valor
Cambio absoluto
El cambio con respecto al valor anterior
1 ene 1962 año
4.155
+4.155
0.0%
1 ene 1963 año
3.486
-0.669
-16.11%
1 ene 1964 año
-0.162
-3.648
-104.65%
1 ene 1965 año
24.709
+24.871
-15.34 mil%
1 ene 1966 año
-18.039
-42.748
-173.0%
1 ene 1967 año
32.955
+50.993
-282.69%
1 ene 1968 año
-21.581
-54.536
-165.49%
1 ene 1969 año
25.341
+46.922
-217.42%
1 ene 1970 año
6.304
-19.036
-75.12%
1 ene 1971 año
19.223
+12.919
204.91%
1 ene 1972 año
15.094
-4.129
-21.48%
1 ene 1973 año
-4.769
-19.863
-131.59%
1 ene 1974 año
2.034
+6.803
-142.66%
1 ene 1975 año
-2.147
-4.182
-205.55%
1 ene 1976 año
-10.972
-8.825
410.97%
1 ene 1977 año
12.324
+23.296
-212.32%
1 ene 1978 año
9.718
-2.606
-21.15%
1 ene 1979 año
20.714
+10.996
113.16%
1 ene 1980 año
0.71
-20.004
-96.57%
1 ene 1981 año
18.801
+18.091
2.55 mil%
1 ene 1982 año
4.946
-13.856
-73.7%
1 ene 1983 año
7.917
+2.971
60.08%
1 ene 1984 año
-9.083
-17.0
-214.73%
1 ene 1985 año
-3.939
+5.144
-56.64%
1 ene 1986 año
-6.6
-2.661
67.58%
1 ene 1987 año
4.069
+10.669
-161.64%
1 ene 1988 año
5.35
+1.281
31.49%
1 ene 1989 año
6.543
+1.193
22.3%
1 ene 1990 año
-2.841
-9.384
-143.43%
1 ene 1991 año
7.83
+10.672
-375.57%
1 ene 1992 año
3.412
-4.418
-56.42%
1 ene 1993 año
41.371
+37.958
1.11 mil%
1 ene 1994 año
44.311
+2.94
7.11%
1 ene 1995 año
18.021
-26.289
-59.33%
1 ene 1996 año
7.261
-10.76
-59.71%
1 ene 1997 año
2.291
-4.97
-68.45%
1 ene 1998 año
6.193
+3.903
170.37%
1 ene 1999 año
-3.913
-10.106
-163.18%
1 ene 2000 año
-24.681
-20.768
530.72%
1 ene 2001 año
12.233
+36.914
-149.57%
1 ene 2002 año
8.74
-3.493
-28.56%
1 ene 2003 año
0.329
-8.411
-96.24%
1 ene 2004 año
8.17
+7.841
2.38 mil%
1 ene 2005 año
10.272
+2.102
25.73%
1 ene 2006 año
11.902
+1.63
15.87%
1 ene 2007 año
19.968
+8.066
67.77%
1 ene 2008 año
14.046
-5.922
-29.66%
1 ene 2009 año
10.476
-3.57
-25.42%
1 ene 2010 año
-9.149
-19.625
-187.34%
1 ene 2011 año
10.845
+19.994
-218.54%
1 ene 2012 año
21.487
+10.642
98.12%
1 ene 2013 año
9.074
-12.412
-57.77%
1 ene 2014 año
5.978
-3.097
-34.13%
1 ene 2015 año
7.783
+1.806
30.21%
1 ene 2016 año
3.885
-3.898
-50.08%
Ranking de los países por los datos estadísticos actuales


Comentarios: