29
/es/
es
AIzaSyAYiBZKx7MnpbEhh9jyipgxe19OcubqV5w
April 1, 2024
104990
Chile
CHL
true
2
1
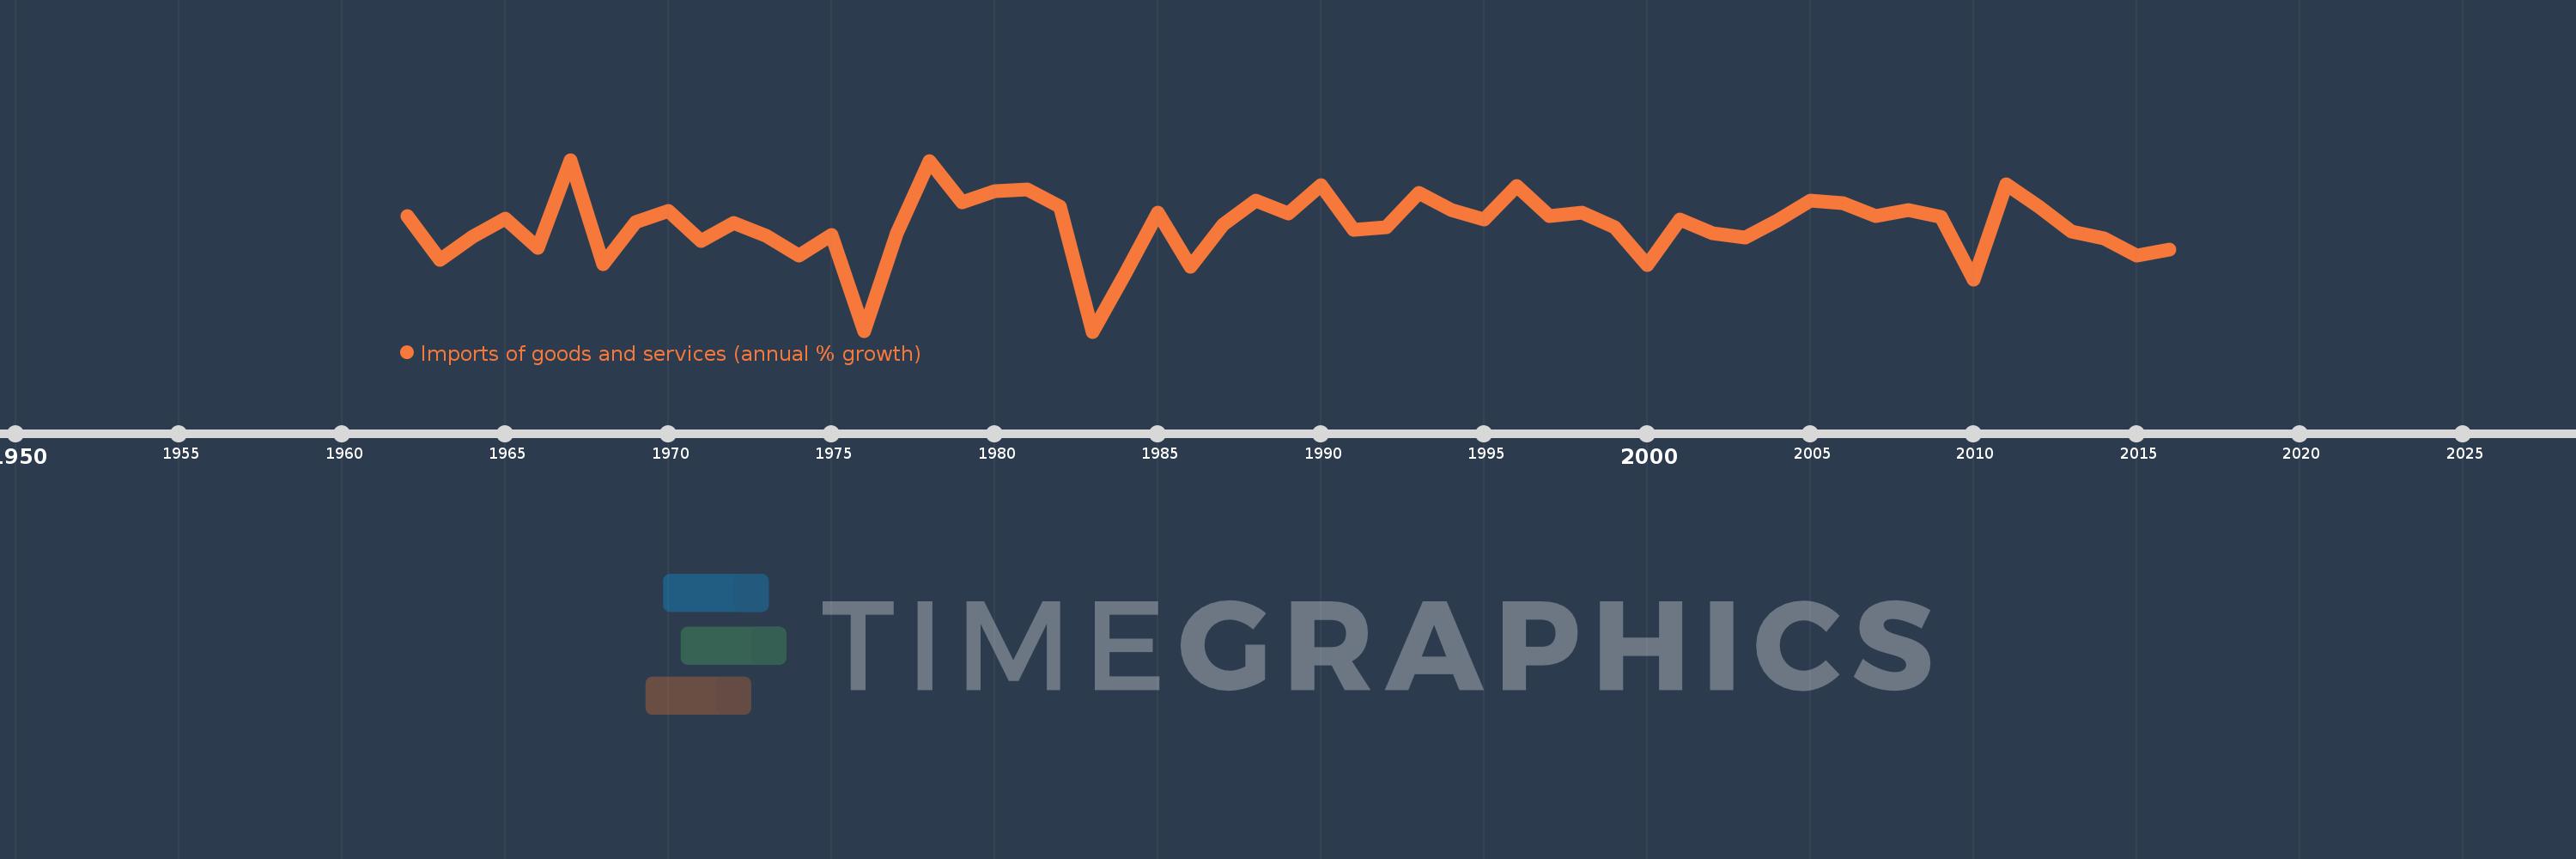
Imports of goods and services (annual % growth)
2016,2015,2014,2013,2012,2011,2010,2009,2008,2007,2006,2005,2004,2003,2002,2001,2000,1999,1998,1997,1996,1995,1994,1993,1992,1991,1990,1989,1988,1987,1986,1985,1984,1983,1982,1981,1980,1979,1978,1977,1976,1975,1974,1973,1972,1971,1970,1969,1968,1967,1966,1965,1964,1963,1962
Estas estadísticas en otros países:
AlbaniaAlgeriaAngolaAntigua and BarbudaArab WorldArgentinaArmeniaAustraliaAustriaAzerbaijanBahamas, TheBahrainBangladeshBarbadosBelarusBelgiumBelizeBeninBhutanBoliviaBosnia and HerzegovinaBotswanaBrazilBrunei DarussalamBulgariaBurkina FasoBurundiCabo VerdeCambodiaCameroonCanadaCaribbean small statesCentral Europe and the BalticsChadChileColombiaComorosCongo, Dem. Rep.Congo, Rep.Costa RicaCote d'IvoireCroatiaCubaCyprusCzech RepublicDenmarkDjiboutiDominican RepublicEarly-demographic dividendEast Asia & PacificEcuadorEgypt, Arab Rep.El SalvadorEquatorial GuineaEritreaEstoniaEthiopiaEuro areaEurope & Central AsiaEurope & Central Asia (excluding high income)Europe & Central Asia (IDA & IBRD countries)European UnionFijiFinlandFranceGabonGambia, TheGeorgiaGermanyGhanaGreeceGuatemalaGuineaGuinea-BissauHaitiHeavily indebted poor countries (HIPC)High incomeHondurasHong Kong SAR, ChinaHungaryIBRD onlyIcelandIDA & IBRD totalIDA blendIDA onlyIDA totalIndiaIndonesiaIran, Islamic Rep.IrelandIsraelItalyJamaicaJapanJordanKazakhstanKenyaKorea, Rep.KosovoKuwaitKyrgyz RepublicLao PDRLatin America & Caribbean Latin America & Caribbean (excluding high income)Latin America & the Caribbean (IDA & IBRD countries)LatviaLeast developed countries: UN classificationLebanonLiberiaLibyaLithuaniaLow & middle incomeLow incomeLower middle incomeLuxembourgMacao SAR, ChinaMacedonia, FYRMadagascarMalawiMalaysiaMaliMaltaMauritaniaMauritiusMexicoMiddle East & North AfricaMiddle East & North Africa (excluding high income)Middle East & North Africa (IDA & IBRD countries)Middle incomeMoldovaMongoliaMontenegroMoroccoMozambiqueMyanmarNamibiaNepalNetherlandsNew ZealandNicaraguaNigerNigeriaNorth AmericaNorwayOECD membersOmanOther small statesPakistanPanamaPapua New GuineaParaguayPeruPhilippinesPolandPortugalPost-demographic dividendPre-demographic dividendPuerto RicoQatarRomaniaRussian FederationRwandaSamoaSaudi ArabiaSenegalSerbiaSeychellesSierra LeoneSingaporeSlovak RepublicSloveniaSmall statesSomaliaSouth AfricaSouth AsiaSouth Asia (IDA & IBRD)South SudanSpainSri LankaSub-Saharan Africa Sub-Saharan Africa (excluding high income)Sub-Saharan Africa (IDA & IBRD countries)SudanSurinameSwazilandSwedenSwitzerlandSyrian Arab RepublicTajikistanTanzaniaThailandTimor-LesteTogoTrinidad and TobagoTunisiaTurkeyTurkmenistanUgandaUkraineUnited Arab EmiratesUnited KingdomUnited StatesUruguayUzbekistanVanuatuVenezuela, RBVietnamWest Bank and GazaWorldZambiaZimbabwe línea de tiempo (timeline):
En esta escala de tiempo se presenta un gráfico de 1962 y 2016 de Chile. Los datos de 1961 están ausentes. El número de observaciones reales por fecha: 55.
Fuente (nombre):
Indicadores del desarrollo mundial
Fuente (organización):
World Bank national accounts data, and OECD National Accounts data files.
Categorías:
Economy & Growth, Trade
Se ha actualizado:
23 abr 2017 año
Los indicadores de los cambios de valor en los últimos años
Mínimo:
-38.734
1 ene 1983 año
Máximo:
36.258
1 ene 1967 año
A la fecha de observación
Valor
Cambio absoluto
El cambio con respecto al valor anterior
1 ene 1962 año
11.807
+11.807
0.0%
1 ene 1963 año
-7.592
-19.399
-164.3%
1 ene 1964 año
2.605
+10.197
-134.31%
1 ene 1965 año
10.643
+8.038
308.55%
1 ene 1966 año
-2.17
-12.813
-120.38%
1 ene 1967 año
36.258
+38.428
-1.77 mil%
1 ene 1968 año
-9.211
-45.469
-125.4%
1 ene 1969 año
9.058
+18.269
-198.34%
1 ene 1970 año
14.034
+4.977
54.94%
1 ene 1971 año
0.947
-13.087
-93.25%
1 ene 1972 año
8.533
+7.585
800.8%
1 ene 1973 año
3.154
-5.378
-63.03%
1 ene 1974 año
-5.415
-8.569
-271.65%
1 ene 1975 año
3.366
+8.781
-162.17%
1 ene 1976 año
-38.669
-42.035
-1.25 mil%
1 ene 1977 año
4.294
+42.963
-111.1%
1 ene 1978 año
35.53
+31.236
727.49%
1 ene 1979 año
17.556
-17.973
-50.59%
1 ene 1980 año
22.662
+5.106
29.08%
1 ene 1981 año
23.477
+0.815
3.59%
1 ene 1982 año
15.708
-7.769
-33.09%
1 ene 1983 año
-38.734
-54.442
-346.59%
1 ene 1984 año
-13.336
+25.398
-65.57%
1 ene 1985 año
13.162
+26.497
-198.7%
1 ene 1986 año
-10.325
-23.487
-178.45%
1 ene 1987 año
7.904
+18.229
-176.56%
1 ene 1988 año
18.61
+10.705
135.44%
1 ene 1989 año
12.794
-5.816
-31.25%
1 ene 1990 año
25.038
+12.244
95.7%
1 ene 1991 año
5.809
-19.228
-76.8%
1 ene 1992 año
6.952
+1.143
19.68%
1 ene 1993 año
21.808
+14.856
213.69%
1 ene 1994 año
14.181
-7.627
-34.97%
1 ene 1995 año
10.119
-4.062
-28.65%
1 ene 1996 año
24.981
+14.862
146.87%
1 ene 1997 año
11.833
-13.148
-52.63%
1 ene 1998 año
13.185
+1.352
11.42%
1 ene 1999 año
6.72
-6.465
-49.03%
1 ene 2000 año
-9.53
-16.25
-241.82%
1 ene 2001 año
10.054
+19.584
-205.5%
1 ene 2002 año
4.085
-5.969
-59.37%
1 ene 2003 año
2.251
-1.834
-44.89%
1 ene 2004 año
9.736
+7.484
332.41%
1 ene 2005 año
18.411
+8.676
89.11%
1 ene 2006 año
17.175
-1.236
-6.71%
1 ene 2007 año
11.802
-5.374
-31.29%
1 ene 2008 año
14.28
+2.479
21.0%
1 ene 2009 año
11.224
-3.057
-21.41%
1 ene 2010 año
-16.168
-27.392
-244.06%
1 ene 2011 año
25.487
+41.655
-257.64%
1 ene 2012 año
15.977
-9.51
-37.31%
1 ene 2013 año
4.777
-11.2
-70.1%
1 ene 2014 año
2.091
-2.687
-56.24%
1 ene 2015 año
-5.662
-7.753
-370.86%
1 ene 2016 año
-2.838
+2.824
-49.87%
Ranking de los países por los datos estadísticos actuales


Comentarios: