29
/es/
es
AIzaSyAYiBZKx7MnpbEhh9jyipgxe19OcubqV5w
April 1, 2024
219690
Papua New Guinea
PNG
true
2
1
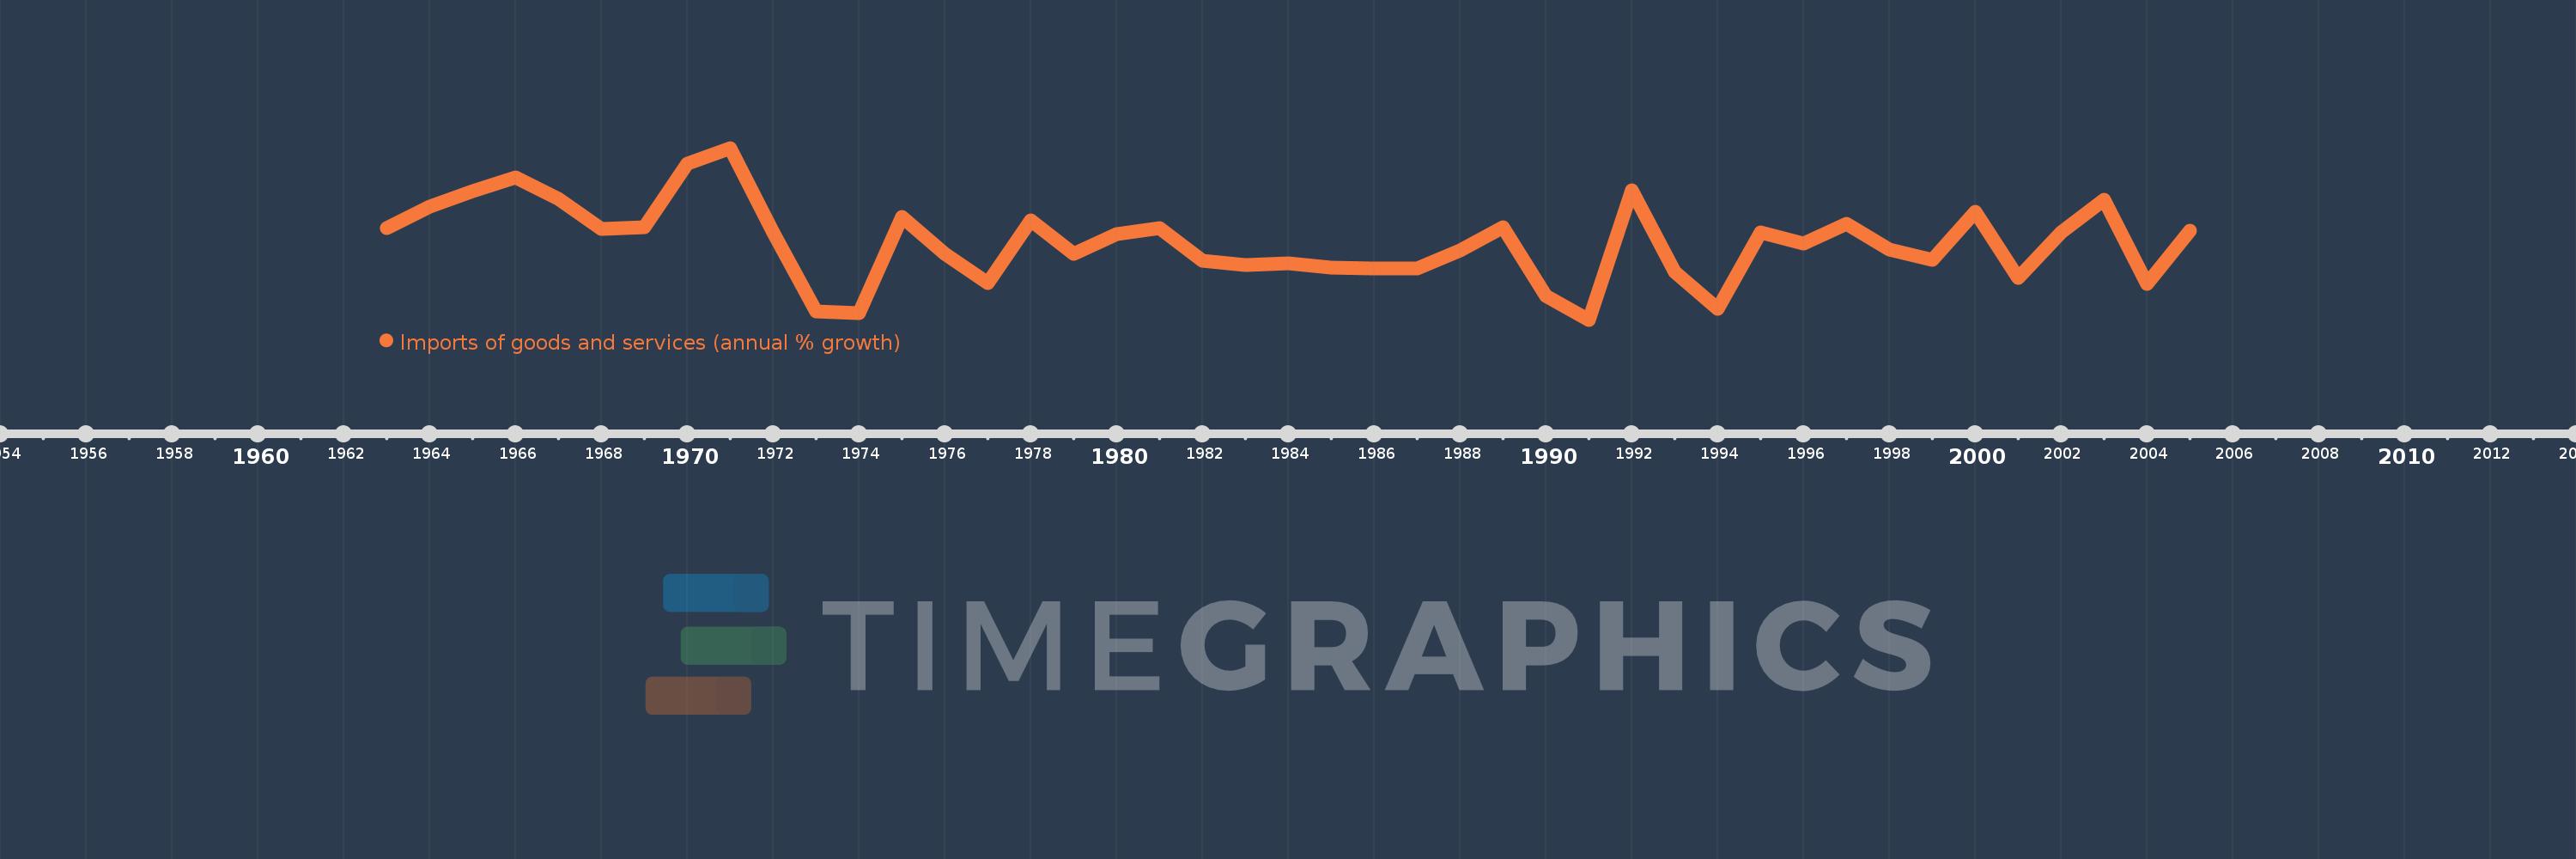
Imports of goods and services (annual % growth)
2005,2004,2003,2002,2001,2000,1999,1998,1997,1996,1995,1994,1993,1992,1991,1990,1989,1988,1987,1986,1985,1984,1983,1982,1981,1980,1979,1978,1977,1976,1975,1974,1973,1972,1971,1970,1969,1968,1967,1966,1965,1964,1963
Estas estadísticas en otros países:
AlbaniaAlgeriaAngolaAntigua and BarbudaArab WorldArgentinaArmeniaAustraliaAustriaAzerbaijanBahamas, TheBahrainBangladeshBarbadosBelarusBelgiumBelizeBeninBhutanBoliviaBosnia and HerzegovinaBotswanaBrazilBrunei DarussalamBulgariaBurkina FasoBurundiCabo VerdeCambodiaCameroonCanadaCaribbean small statesCentral Europe and the BalticsChadChileColombiaComorosCongo, Dem. Rep.Congo, Rep.Costa RicaCote d'IvoireCroatiaCubaCyprusCzech RepublicDenmarkDjiboutiDominican RepublicEarly-demographic dividendEast Asia & PacificEcuadorEgypt, Arab Rep.El SalvadorEquatorial GuineaEritreaEstoniaEthiopiaEuro areaEurope & Central AsiaEurope & Central Asia (excluding high income)Europe & Central Asia (IDA & IBRD countries)European UnionFijiFinlandFranceGabonGambia, TheGeorgiaGermanyGhanaGreeceGuatemalaGuineaGuinea-BissauHaitiHeavily indebted poor countries (HIPC)High incomeHondurasHong Kong SAR, ChinaHungaryIBRD onlyIcelandIDA & IBRD totalIDA blendIDA onlyIDA totalIndiaIndonesiaIran, Islamic Rep.IrelandIsraelItalyJamaicaJapanJordanKazakhstanKenyaKorea, Rep.KosovoKuwaitKyrgyz RepublicLao PDRLatin America & Caribbean Latin America & Caribbean (excluding high income)Latin America & the Caribbean (IDA & IBRD countries)LatviaLeast developed countries: UN classificationLebanonLiberiaLibyaLithuaniaLow & middle incomeLow incomeLower middle incomeLuxembourgMacao SAR, ChinaMacedonia, FYRMadagascarMalawiMalaysiaMaliMaltaMauritaniaMauritiusMexicoMiddle East & North AfricaMiddle East & North Africa (excluding high income)Middle East & North Africa (IDA & IBRD countries)Middle incomeMoldovaMongoliaMontenegroMoroccoMozambiqueMyanmarNamibiaNepalNetherlandsNew ZealandNicaraguaNigerNigeriaNorth AmericaNorwayOECD membersOmanOther small statesPakistanPanamaPapua New GuineaParaguayPeruPhilippinesPolandPortugalPost-demographic dividendPre-demographic dividendPuerto RicoQatarRomaniaRussian FederationRwandaSamoaSaudi ArabiaSenegalSerbiaSeychellesSierra LeoneSingaporeSlovak RepublicSloveniaSmall statesSomaliaSouth AfricaSouth AsiaSouth Asia (IDA & IBRD)South SudanSpainSri LankaSub-Saharan Africa Sub-Saharan Africa (excluding high income)Sub-Saharan Africa (IDA & IBRD countries)SudanSurinameSwazilandSwedenSwitzerlandSyrian Arab RepublicTajikistanTanzaniaThailandTimor-LesteTogoTrinidad and TobagoTunisiaTurkeyTurkmenistanUgandaUkraineUnited Arab EmiratesUnited KingdomUnited StatesUruguayUzbekistanVanuatuVenezuela, RBVietnamWest Bank and GazaWorldZambiaZimbabwe línea de tiempo (timeline):
En esta escala de tiempo se presenta un gráfico de 1963 y 2005 de Papua New Guinea. Los datos de 1962 están ausentes. El número de observaciones reales por fecha: 43.
Fuente (nombre):
Indicadores del desarrollo mundial
Fuente (organización):
World Bank national accounts data, and OECD National Accounts data files.
Categorías:
Economy & Growth, Trade
Se ha actualizado:
23 abr 2017 año
Los indicadores de los cambios de valor en los últimos años
Mínimo:
-16.734
1 ene 1991 año
Máximo:
32.286
1 ene 1971 año
A la fecha de observación
Valor
Cambio absoluto
El cambio con respecto al valor anterior
1 ene 1963 año
9.315
+9.315
0.0%
1 ene 1964 año
15.555
+6.24
66.99%
1 ene 1965 año
19.896
+4.341
27.91%
1 ene 1966 año
23.934
+4.038
20.3%
1 ene 1967 año
17.767
-6.167
-25.77%
1 ene 1968 año
9.243
-8.524
-47.98%
1 ene 1969 año
9.698
+0.455
4.93%
1 ene 1970 año
27.816
+18.118
186.82%
1 ene 1971 año
32.286
+4.471
16.07%
1 ene 1972 año
8.093
-24.194
-74.93%
1 ene 1973 año
-14.239
-22.332
-275.94%
1 ene 1974 año
-14.741
-0.502
3.52%
1 ene 1975 año
12.511
+27.252
-184.87%
1 ene 1976 año
2.14
-10.371
-82.89%
1 ene 1977 año
-6.383
-8.523
-398.26%
1 ene 1978 año
11.56
+17.943
-281.1%
1 ene 1979 año
2.079
-9.481
-82.02%
1 ene 1980 año
7.699
+5.621
270.41%
1 ene 1981 año
9.538
+1.839
23.88%
1 ene 1982 año
0.155
-9.384
-98.38%
1 ene 1983 año
-1.175
-1.329
-859.91%
1 ene 1984 año
-0.642
+0.533
-45.34%
1 ene 1985 año
-1.808
-1.166
181.53%
1 ene 1986 año
-2.036
-0.229
12.66%
1 ene 1987 año
-2.033
+0.003
-0.15%
1 ene 1988 año
2.956
+4.989
-245.37%
1 ene 1989 año
9.738
+6.782
229.45%
1 ene 1990 año
-10.063
-19.801
-203.34%
1 ene 1991 año
-16.734
-6.67
66.29%
1 ene 1992 año
20.085
+36.819
-220.03%
1 ene 1993 año
-3.028
-23.113
-115.07%
1 ene 1994 año
-13.505
-10.477
346.04%
1 ene 1995 año
8.242
+21.747
-161.03%
1 ene 1996 año
5.073
-3.169
-38.45%
1 ene 1997 año
10.65
+5.577
109.94%
1 ene 1998 año
3.214
-7.436
-69.82%
1 ene 1999 año
0.385
-2.829
-88.02%
1 ene 2000 año
14.008
+13.623
3.54 mil%
1 ene 2001 año
-4.749
-18.757
-133.9%
1 ene 2002 año
8.27
+13.019
-274.14%
1 ene 2003 año
17.522
+9.252
111.87%
1 ene 2004 año
-6.445
-23.967
-136.78%
1 ene 2005 año
8.632
+15.078
-233.93%
Ranking de los países por los datos estadísticos actuales


Comentarios: