29
/es/
es
AIzaSyAYiBZKx7MnpbEhh9jyipgxe19OcubqV5w
April 1, 2024
26598
Early-demographic dividend
EAR
false
2
1
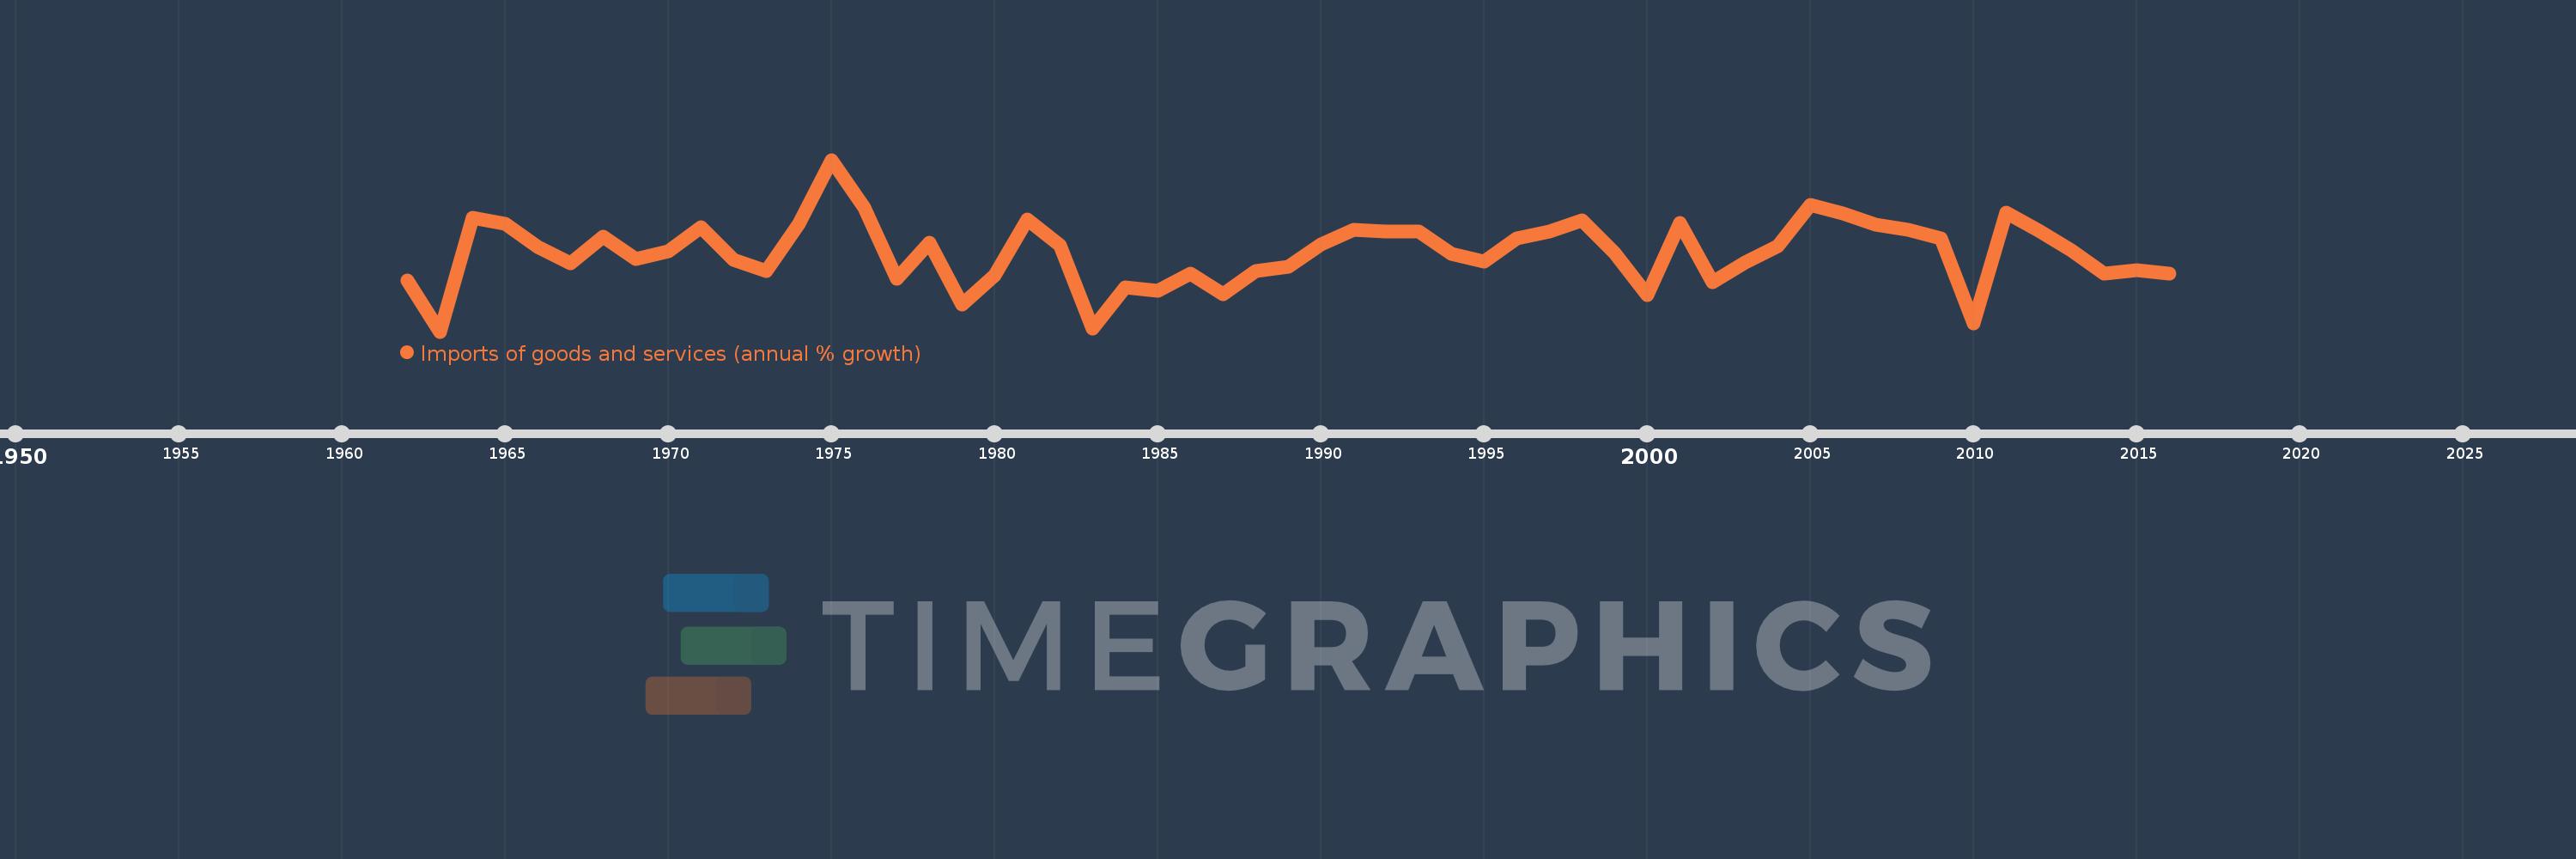
Imports of goods and services (annual % growth)
2016,2015,2014,2013,2012,2011,2010,2009,2008,2007,2006,2005,2004,2003,2002,2001,2000,1999,1998,1997,1996,1995,1994,1993,1992,1991,1990,1989,1988,1987,1986,1985,1984,1983,1982,1981,1980,1979,1978,1977,1976,1975,1974,1973,1972,1971,1970,1969,1968,1967,1966,1965,1964,1963,1962
Estas estadísticas en otros países:
AlbaniaAlgeriaAngolaAntigua and BarbudaArab WorldArgentinaArmeniaAustraliaAustriaAzerbaijanBahamas, TheBahrainBangladeshBarbadosBelarusBelgiumBelizeBeninBhutanBoliviaBosnia and HerzegovinaBotswanaBrazilBrunei DarussalamBulgariaBurkina FasoBurundiCabo VerdeCambodiaCameroonCanadaCaribbean small statesCentral Europe and the BalticsChadChileColombiaComorosCongo, Dem. Rep.Congo, Rep.Costa RicaCote d'IvoireCroatiaCubaCyprusCzech RepublicDenmarkDjiboutiDominican RepublicEarly-demographic dividendEast Asia & PacificEcuadorEgypt, Arab Rep.El SalvadorEquatorial GuineaEritreaEstoniaEthiopiaEuro areaEurope & Central AsiaEurope & Central Asia (excluding high income)Europe & Central Asia (IDA & IBRD countries)European UnionFijiFinlandFranceGabonGambia, TheGeorgiaGermanyGhanaGreeceGuatemalaGuineaGuinea-BissauHaitiHeavily indebted poor countries (HIPC)High incomeHondurasHong Kong SAR, ChinaHungaryIBRD onlyIcelandIDA & IBRD totalIDA blendIDA onlyIDA totalIndiaIndonesiaIran, Islamic Rep.IrelandIsraelItalyJamaicaJapanJordanKazakhstanKenyaKorea, Rep.KosovoKuwaitKyrgyz RepublicLao PDRLatin America & Caribbean Latin America & Caribbean (excluding high income)Latin America & the Caribbean (IDA & IBRD countries)LatviaLeast developed countries: UN classificationLebanonLiberiaLibyaLithuaniaLow & middle incomeLow incomeLower middle incomeLuxembourgMacao SAR, ChinaMacedonia, FYRMadagascarMalawiMalaysiaMaliMaltaMauritaniaMauritiusMexicoMiddle East & North AfricaMiddle East & North Africa (excluding high income)Middle East & North Africa (IDA & IBRD countries)Middle incomeMoldovaMongoliaMontenegroMoroccoMozambiqueMyanmarNamibiaNepalNetherlandsNew ZealandNicaraguaNigerNigeriaNorth AmericaNorwayOECD membersOmanOther small statesPakistanPanamaPapua New GuineaParaguayPeruPhilippinesPolandPortugalPost-demographic dividendPre-demographic dividendPuerto RicoQatarRomaniaRussian FederationRwandaSamoaSaudi ArabiaSenegalSerbiaSeychellesSierra LeoneSingaporeSlovak RepublicSloveniaSmall statesSomaliaSouth AfricaSouth AsiaSouth Asia (IDA & IBRD)South SudanSpainSri LankaSub-Saharan Africa Sub-Saharan Africa (excluding high income)Sub-Saharan Africa (IDA & IBRD countries)SudanSurinameSwazilandSwedenSwitzerlandSyrian Arab RepublicTajikistanTanzaniaThailandTimor-LesteTogoTrinidad and TobagoTunisiaTurkeyTurkmenistanUgandaUkraineUnited Arab EmiratesUnited KingdomUnited StatesUruguayUzbekistanVanuatuVenezuela, RBVietnamWest Bank and GazaWorldZambiaZimbabwe línea de tiempo (timeline):
En esta escala de tiempo se presenta un gráfico de 1962 y 2016 de Early-demographic dividend. Los datos de 1961 están ausentes. El número de observaciones reales por fecha: 55.
Fuente (nombre):
Indicadores del desarrollo mundial
Fuente (organización):
World Bank national accounts data, and OECD National Accounts data files.
Categorías:
Economy & Growth, Trade
Se ha actualizado:
23 abr 2017 año
Los indicadores de los cambios de valor en los últimos años
Mínimo:
-12.179
1 ene 1963 año
Máximo:
26.18
1 ene 1975 año
A la fecha de observación
Valor
Cambio absoluto
El cambio con respecto al valor anterior
1 ene 1962 año
-0.837
-0.837
0.0%
1 ene 1963 año
-12.179
-11.342
1.35 mil%
1 ene 1964 año
13.28
+25.459
-209.03%
1 ene 1965 año
11.893
-1.387
-10.44%
1 ene 1966 año
6.776
-5.117
-43.03%
1 ene 1967 año
3.023
-3.753
-55.39%
1 ene 1968 año
9.099
+6.076
201.02%
1 ene 1969 año
3.964
-5.134
-56.43%
1 ene 1970 año
5.706
+1.742
43.94%
1 ene 1971 año
11.199
+5.493
96.26%
1 ene 1972 año
3.849
-7.35
-65.63%
1 ene 1973 año
1.292
-2.556
-66.42%
1 ene 1974 año
11.936
+10.644
823.52%
1 ene 1975 año
26.18
+14.244
119.34%
1 ene 1976 año
15.554
-10.626
-40.59%
1 ene 1977 año
-0.304
-15.858
-101.95%
1 ene 1978 año
7.762
+8.066
-2.65 mil%
1 ene 1979 año
-6.042
-13.804
-177.83%
1 ene 1980 año
0.288
+6.33
-104.77%
1 ene 1981 año
12.899
+12.611
4.38 mil%
1 ene 1982 año
7.088
-5.811
-45.05%
1 ene 1983 año
-11.556
-18.644
-263.03%
1 ene 1984 año
-2.372
+9.184
-79.47%
1 ene 1985 año
-3.135
-0.763
32.16%
1 ene 1986 año
0.791
+3.927
-125.24%
1 ene 1987 año
-3.85
-4.641
-586.52%
1 ene 1988 año
1.304
+5.154
-133.87%
1 ene 1989 año
2.332
+1.027
78.78%
1 ene 1990 año
7.376
+5.044
216.34%
1 ene 1991 año
10.644
+3.268
44.3%
1 ene 1992 año
10.093
-0.55
-5.17%
1 ene 1993 año
10.115
+0.022
0.22%
1 ene 1994 año
5.117
-4.999
-49.42%
1 ene 1995 año
3.512
-1.605
-31.36%
1 ene 1996 año
8.569
+5.057
143.99%
1 ene 1997 año
10.158
+1.589
18.55%
1 ene 1998 año
12.676
+2.518
24.78%
1 ene 1999 año
5.379
-7.297
-57.57%
1 ene 2000 año
-4.0
-9.378
-174.36%
1 ene 2001 año
12.126
+16.126
-403.18%
1 ene 2002 año
-1.211
-13.337
-109.99%
1 ene 2003 año
3.274
+4.485
-370.35%
1 ene 2004 año
6.823
+3.549
108.42%
1 ene 2005 año
16.05
+9.227
135.23%
1 ene 2006 año
14.179
-1.871
-11.66%
1 ene 2007 año
11.609
-2.57
-18.12%
1 ene 2008 año
10.564
-1.045
-9.0%
1 ene 2009 año
8.676
-1.887
-17.86%
1 ene 2010 año
-10.438
-19.114
-220.3%
1 ene 2011 año
14.306
+24.744
-237.06%
1 ene 2012 año
10.288
-4.018
-28.09%
1 ene 2013 año
5.884
-4.404
-42.81%
1 ene 2014 año
0.686
-5.197
-88.34%
1 ene 2015 año
1.558
+0.871
126.94%
1 ene 2016 año
0.742
-0.816
-52.38%
Ranking de los países por los datos estadísticos actuales


Comentarios: