29
/es/
es
AIzaSyAYiBZKx7MnpbEhh9jyipgxe19OcubqV5w
April 1, 2024
103723
Chad
TCD
true
2
1
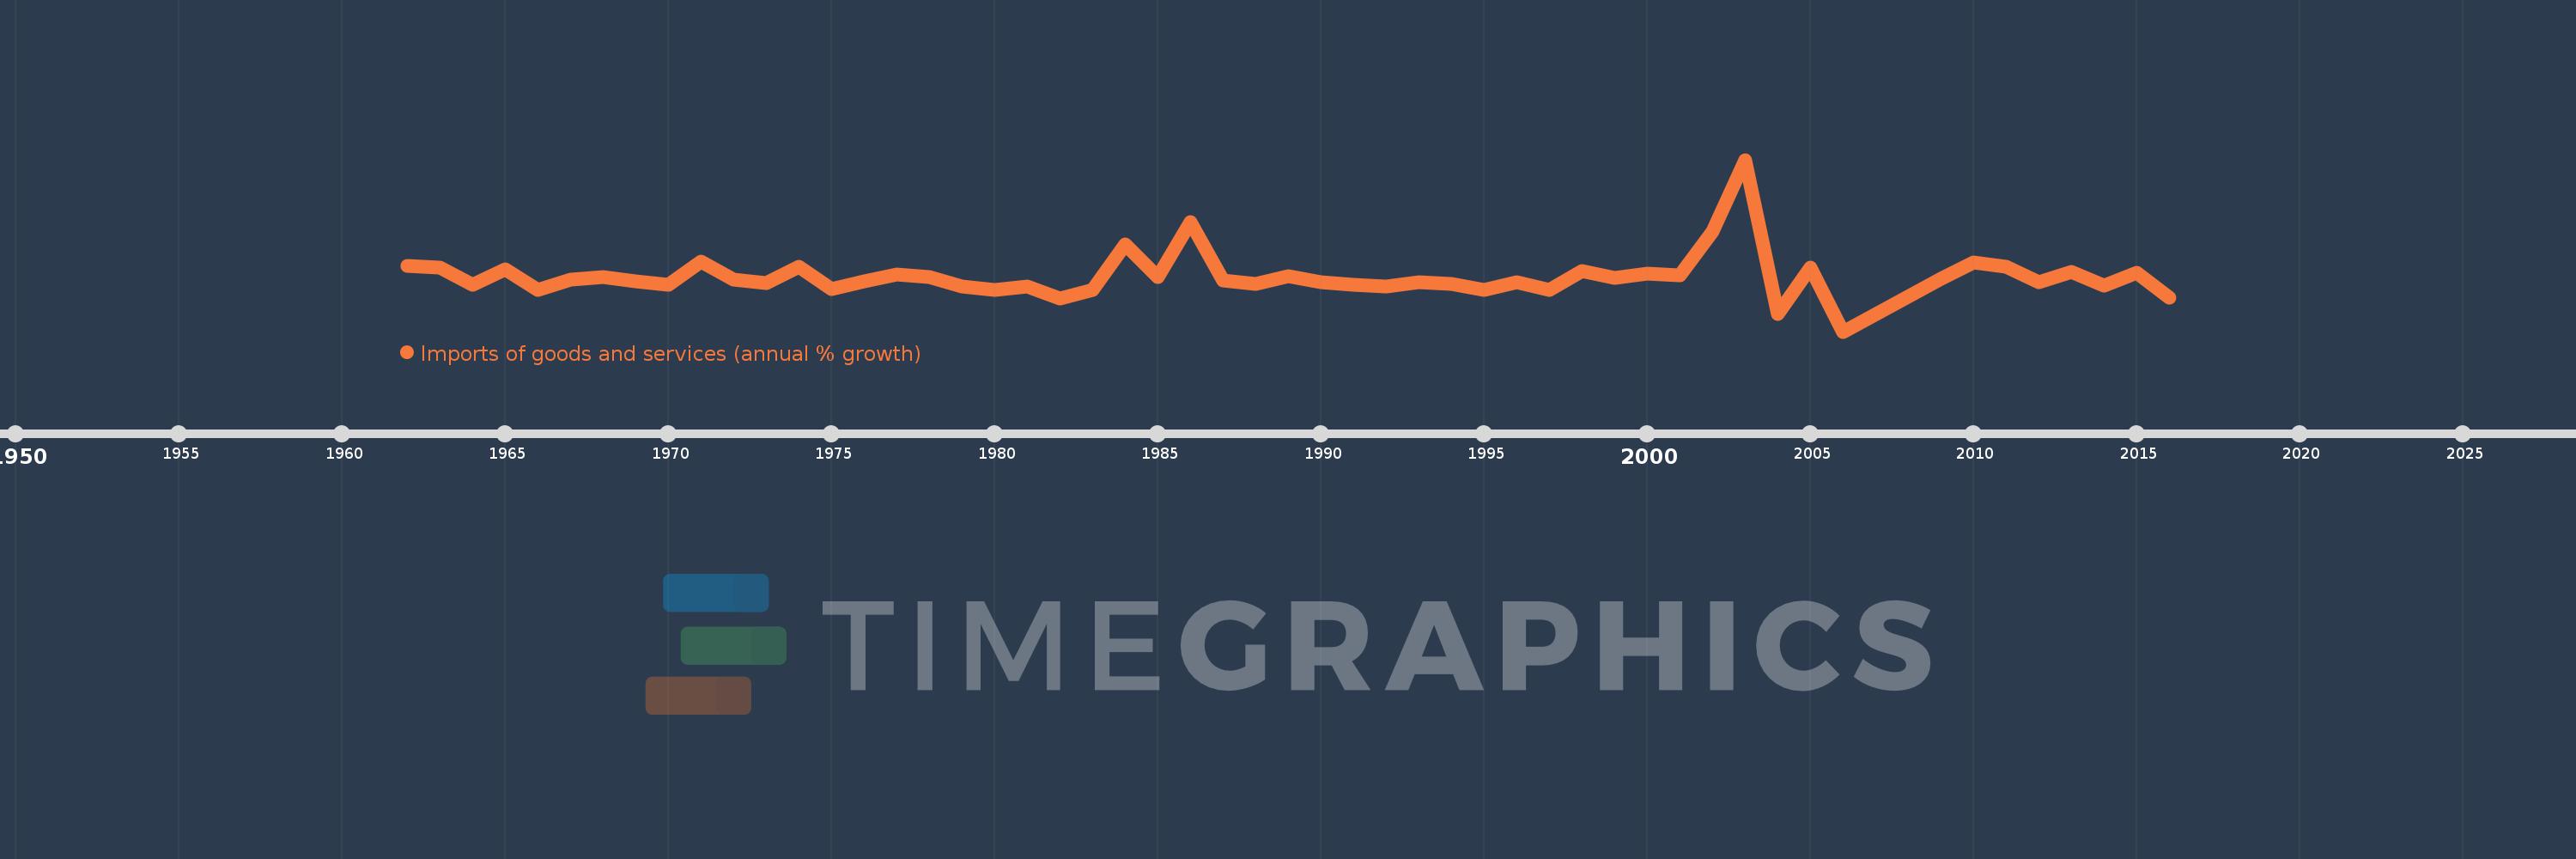
Imports of goods and services (annual % growth)
2016,2015,2014,2013,2012,2011,2010,2009,2006,2005,2004,2003,2002,2001,2000,1999,1998,1997,1996,1995,1994,1993,1992,1991,1990,1989,1988,1987,1986,1985,1984,1983,1982,1981,1980,1979,1978,1977,1976,1975,1974,1973,1972,1971,1970,1969,1968,1967,1966,1965,1964,1963,1962
Estas estadísticas en otros países:
AlbaniaAlgeriaAngolaAntigua and BarbudaArab WorldArgentinaArmeniaAustraliaAustriaAzerbaijanBahamas, TheBahrainBangladeshBarbadosBelarusBelgiumBelizeBeninBhutanBoliviaBosnia and HerzegovinaBotswanaBrazilBrunei DarussalamBulgariaBurkina FasoBurundiCabo VerdeCambodiaCameroonCanadaCaribbean small statesCentral Europe and the BalticsChadChileColombiaComorosCongo, Dem. Rep.Congo, Rep.Costa RicaCote d'IvoireCroatiaCubaCyprusCzech RepublicDenmarkDjiboutiDominican RepublicEarly-demographic dividendEast Asia & PacificEcuadorEgypt, Arab Rep.El SalvadorEquatorial GuineaEritreaEstoniaEthiopiaEuro areaEurope & Central AsiaEurope & Central Asia (excluding high income)Europe & Central Asia (IDA & IBRD countries)European UnionFijiFinlandFranceGabonGambia, TheGeorgiaGermanyGhanaGreeceGuatemalaGuineaGuinea-BissauHaitiHeavily indebted poor countries (HIPC)High incomeHondurasHong Kong SAR, ChinaHungaryIBRD onlyIcelandIDA & IBRD totalIDA blendIDA onlyIDA totalIndiaIndonesiaIran, Islamic Rep.IrelandIsraelItalyJamaicaJapanJordanKazakhstanKenyaKorea, Rep.KosovoKuwaitKyrgyz RepublicLao PDRLatin America & Caribbean Latin America & Caribbean (excluding high income)Latin America & the Caribbean (IDA & IBRD countries)LatviaLeast developed countries: UN classificationLebanonLiberiaLibyaLithuaniaLow & middle incomeLow incomeLower middle incomeLuxembourgMacao SAR, ChinaMacedonia, FYRMadagascarMalawiMalaysiaMaliMaltaMauritaniaMauritiusMexicoMiddle East & North AfricaMiddle East & North Africa (excluding high income)Middle East & North Africa (IDA & IBRD countries)Middle incomeMoldovaMongoliaMontenegroMoroccoMozambiqueMyanmarNamibiaNepalNetherlandsNew ZealandNicaraguaNigerNigeriaNorth AmericaNorwayOECD membersOmanOther small statesPakistanPanamaPapua New GuineaParaguayPeruPhilippinesPolandPortugalPost-demographic dividendPre-demographic dividendPuerto RicoQatarRomaniaRussian FederationRwandaSamoaSaudi ArabiaSenegalSerbiaSeychellesSierra LeoneSingaporeSlovak RepublicSloveniaSmall statesSomaliaSouth AfricaSouth AsiaSouth Asia (IDA & IBRD)South SudanSpainSri LankaSub-Saharan Africa Sub-Saharan Africa (excluding high income)Sub-Saharan Africa (IDA & IBRD countries)SudanSurinameSwazilandSwedenSwitzerlandSyrian Arab RepublicTajikistanTanzaniaThailandTimor-LesteTogoTrinidad and TobagoTunisiaTurkeyTurkmenistanUgandaUkraineUnited Arab EmiratesUnited KingdomUnited StatesUruguayUzbekistanVanuatuVenezuela, RBVietnamWest Bank and GazaWorldZambiaZimbabwe línea de tiempo (timeline):
En esta escala de tiempo se presenta un gráfico de 1962 y 2016 de Chad. Los datos de 1961 están ausentes. El número de observaciones reales por fecha: 53.
Fuente (nombre):
Indicadores del desarrollo mundial
Fuente (organización):
World Bank national accounts data, and OECD National Accounts data files.
Categorías:
Economy & Growth, Trade
Se ha actualizado:
23 abr 2017 año
Los indicadores de los cambios de valor en los últimos años
Mínimo:
-62.656
1 ene 2006 año
Máximo:
148.332
1 ene 2003 año
A la fecha de observación
Valor
Cambio absoluto
El cambio con respecto al valor anterior
1 ene 1962 año
18.543
+18.543
0.0%
1 ene 1963 año
15.642
-2.901
-15.64%
1 ene 1964 año
-4.831
-20.473
-130.88%
1 ene 1965 año
13.706
+18.537
-383.71%
1 ene 1966 año
-11.607
-25.313
-184.69%
1 ene 1967 año
1.515
+13.122
-113.05%
1 ene 1968 año
4.478
+2.962
195.53%
1 ene 1969 año
-1.429
-5.906
-131.91%
1 ene 1970 año
-5.314
-3.885
271.97%
1 ene 1971 año
23.469
+28.783
-541.65%
1 ene 1972 año
1.692
-21.777
-92.79%
1 ene 1973 año
-2.845
-4.537
-268.18%
1 ene 1974 año
17.155
+20.0
-702.88%
1 ene 1975 año
-10.714
-27.868
-162.45%
1 ene 1976 año
-0.801
+9.913
-92.52%
1 ene 1977 año
7.661
+8.462
-1.06 mil%
1 ene 1978 año
4.495
-3.166
-41.33%
1 ene 1979 año
-7.737
-12.232
-272.11%
1 ene 1980 año
-11.895
-4.159
53.75%
1 ene 1981 año
-7.686
+4.209
-35.38%
1 ene 1982 año
-21.782
-14.095
183.38%
1 ene 1983 año
-11.156
+10.625
-48.78%
1 ene 1984 año
43.926
+55.083
-493.74%
1 ene 1985 año
4.279
-39.647
-90.26%
1 ene 1986 año
71.824
+67.545
1.58 mil%
1 ene 1987 año
0.267
-71.557
-99.63%
1 ene 1988 año
-4.417
-4.684
-1.76 mil%
1 ene 1989 año
5.591
+10.008
-226.58%
1 ene 1990 año
-1.922
-7.512
-134.37%
1 ene 1991 año
-5.533
-3.611
187.92%
1 ene 1992 año
-7.096
-1.563
28.25%
1 ene 1993 año
-1.479
+5.617
-79.16%
1 ene 1994 año
-4.255
-2.777
187.8%
1 ene 1995 año
-10.994
-6.738
158.35%
1 ene 1996 año
-2.0
+8.994
-81.81%
1 ene 1997 año
-12.016
-10.016
500.77%
1 ene 1998 año
11.843
+23.858
-198.56%
1 ene 1999 año
2.774
-9.069
-76.58%
1 ene 2000 año
8.126
+5.352
192.94%
1 ene 2001 año
6.792
-1.334
-16.42%
1 ene 2002 año
59.871
+53.08
781.53%
1 ene 2003 año
148.332
+88.461
147.75%
1 ene 2004 año
-40.706
-189.038
-127.44%
1 ene 2005 año
15.463
+56.169
-137.99%
1 ene 2006 año
-62.656
-78.119
-505.2%
1 ene 2009 año
1.891
+64.547
-103.02%
1 ene 2010 año
22.153
+20.262
1.07 mil%
1 ene 2011 año
16.556
-5.597
-25.26%
1 ene 2012 año
-2.242
-18.798
-113.54%
1 ene 2013 año
11.137
+13.38
-596.71%
1 ene 2014 año
-5.8
-16.937
-152.08%
1 ene 2015 año
9.11
+14.91
-257.07%
1 ene 2016 año
-20.6
-29.71
-326.13%
Ranking de los países por los datos estadísticos actuales


Comentarios: