29
/es/
es
AIzaSyAYiBZKx7MnpbEhh9jyipgxe19OcubqV5w
April 1, 2024
141924
Greece
GRC
true
2
1
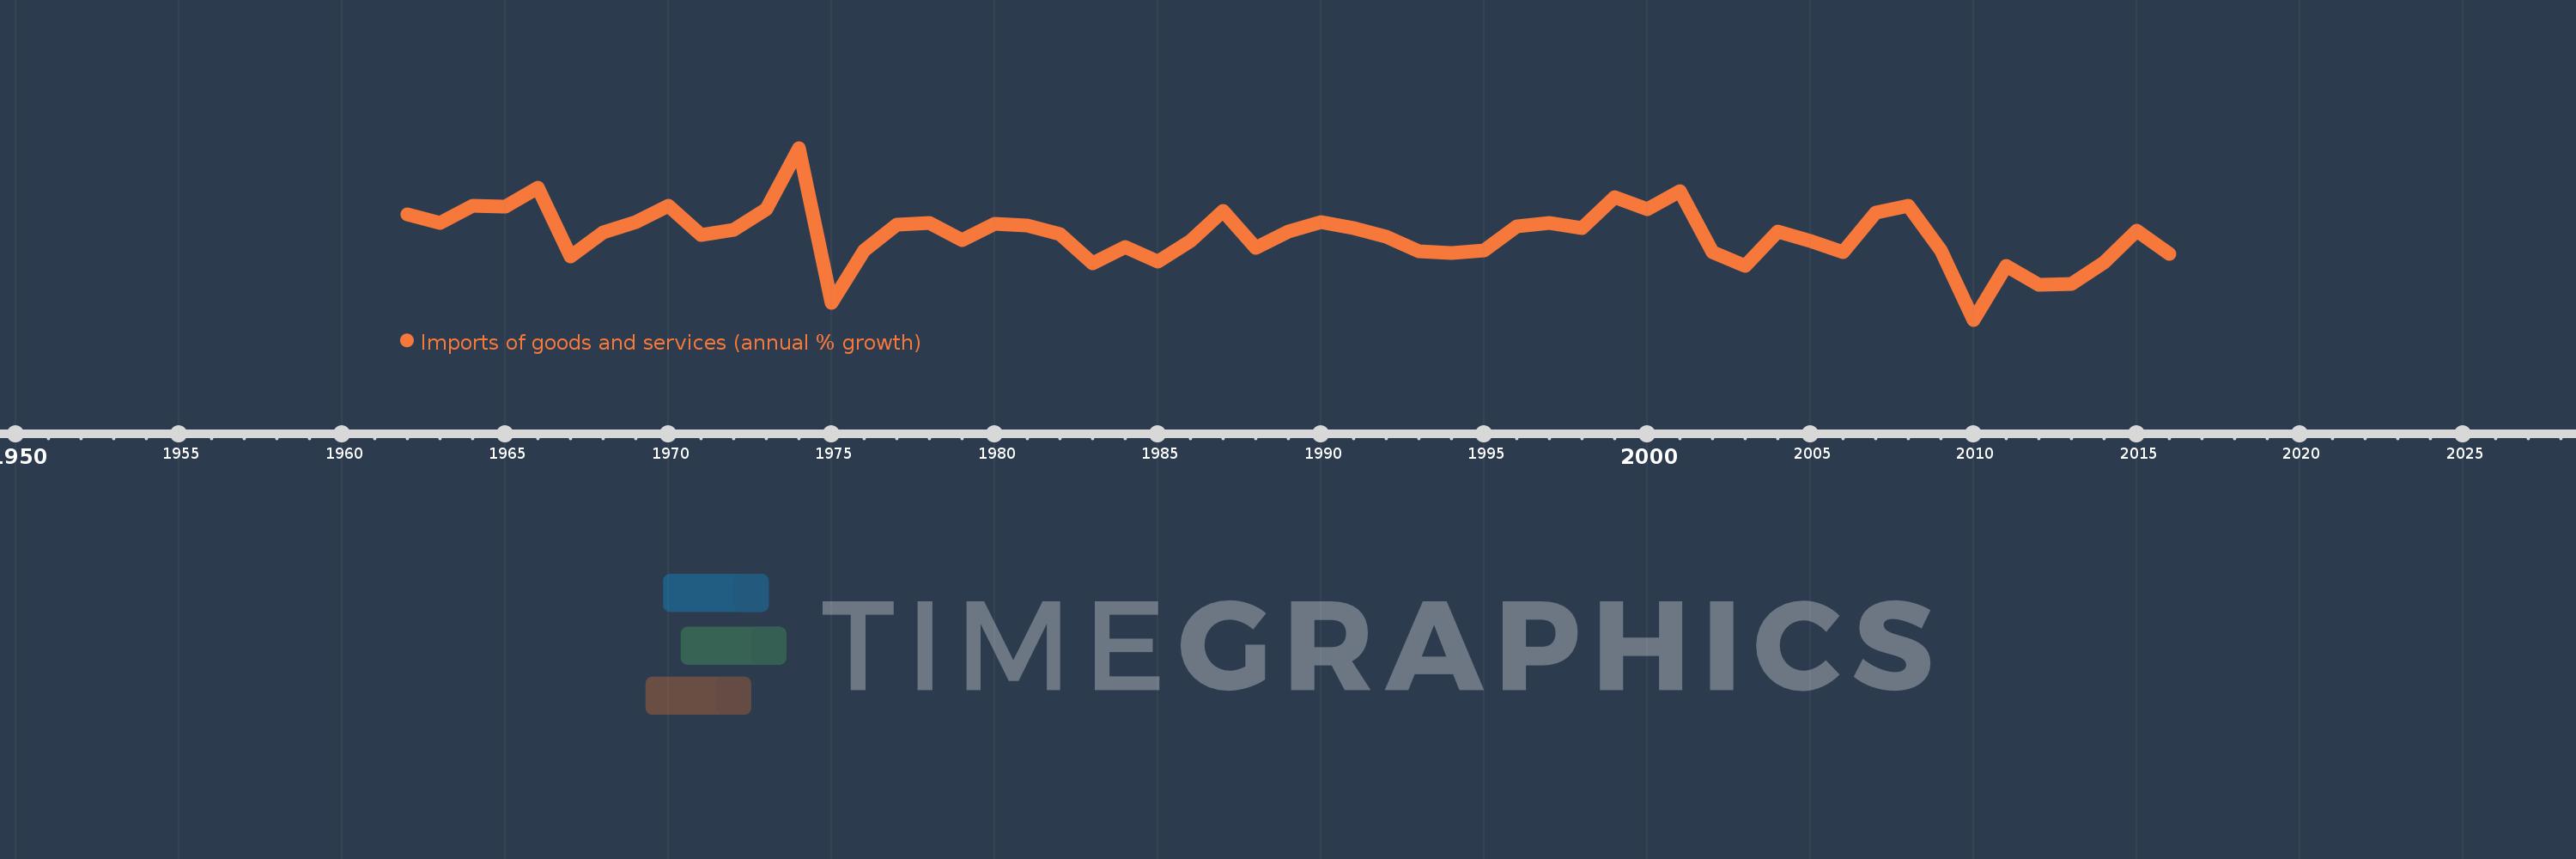
Imports of goods and services (annual % growth)
2016,2015,2014,2013,2012,2011,2010,2009,2008,2007,2006,2005,2004,2003,2002,2001,2000,1999,1998,1997,1996,1995,1994,1993,1992,1991,1990,1989,1988,1987,1986,1985,1984,1983,1982,1981,1980,1979,1978,1977,1976,1975,1974,1973,1972,1971,1970,1969,1968,1967,1966,1965,1964,1963,1962
Estas estadísticas en otros países:
AlbaniaAlgeriaAngolaAntigua and BarbudaArab WorldArgentinaArmeniaAustraliaAustriaAzerbaijanBahamas, TheBahrainBangladeshBarbadosBelarusBelgiumBelizeBeninBhutanBoliviaBosnia and HerzegovinaBotswanaBrazilBrunei DarussalamBulgariaBurkina FasoBurundiCabo VerdeCambodiaCameroonCanadaCaribbean small statesCentral Europe and the BalticsChadChileColombiaComorosCongo, Dem. Rep.Congo, Rep.Costa RicaCote d'IvoireCroatiaCubaCyprusCzech RepublicDenmarkDjiboutiDominican RepublicEarly-demographic dividendEast Asia & PacificEcuadorEgypt, Arab Rep.El SalvadorEquatorial GuineaEritreaEstoniaEthiopiaEuro areaEurope & Central AsiaEurope & Central Asia (excluding high income)Europe & Central Asia (IDA & IBRD countries)European UnionFijiFinlandFranceGabonGambia, TheGeorgiaGermanyGhanaGreeceGuatemalaGuineaGuinea-BissauHaitiHeavily indebted poor countries (HIPC)High incomeHondurasHong Kong SAR, ChinaHungaryIBRD onlyIcelandIDA & IBRD totalIDA blendIDA onlyIDA totalIndiaIndonesiaIran, Islamic Rep.IrelandIsraelItalyJamaicaJapanJordanKazakhstanKenyaKorea, Rep.KosovoKuwaitKyrgyz RepublicLao PDRLatin America & Caribbean Latin America & Caribbean (excluding high income)Latin America & the Caribbean (IDA & IBRD countries)LatviaLeast developed countries: UN classificationLebanonLiberiaLibyaLithuaniaLow & middle incomeLow incomeLower middle incomeLuxembourgMacao SAR, ChinaMacedonia, FYRMadagascarMalawiMalaysiaMaliMaltaMauritaniaMauritiusMexicoMiddle East & North AfricaMiddle East & North Africa (excluding high income)Middle East & North Africa (IDA & IBRD countries)Middle incomeMoldovaMongoliaMontenegroMoroccoMozambiqueMyanmarNamibiaNepalNetherlandsNew ZealandNicaraguaNigerNigeriaNorth AmericaNorwayOECD membersOmanOther small statesPakistanPanamaPapua New GuineaParaguayPeruPhilippinesPolandPortugalPost-demographic dividendPre-demographic dividendPuerto RicoQatarRomaniaRussian FederationRwandaSamoaSaudi ArabiaSenegalSerbiaSeychellesSierra LeoneSingaporeSlovak RepublicSloveniaSmall statesSomaliaSouth AfricaSouth AsiaSouth Asia (IDA & IBRD)South SudanSpainSri LankaSub-Saharan Africa Sub-Saharan Africa (excluding high income)Sub-Saharan Africa (IDA & IBRD countries)SudanSurinameSwazilandSwedenSwitzerlandSyrian Arab RepublicTajikistanTanzaniaThailandTimor-LesteTogoTrinidad and TobagoTunisiaTurkeyTurkmenistanUgandaUkraineUnited Arab EmiratesUnited KingdomUnited StatesUruguayUzbekistanVanuatuVenezuela, RBVietnamWest Bank and GazaWorldZambiaZimbabwe línea de tiempo (timeline):
En esta escala de tiempo se presenta un gráfico de 1962 y 2016 de Greece. Los datos de 1961 están ausentes. El número de observaciones reales por fecha: 55.
Fuente (nombre):
Indicadores del desarrollo mundial
Fuente (organización):
World Bank national accounts data, and OECD National Accounts data files.
Categorías:
Economy & Growth, Trade
Se ha actualizado:
23 abr 2017 año
Los indicadores de los cambios de valor en los últimos años
Mínimo:
-20.354
1 ene 2010 año
Máximo:
33.633
1 ene 1974 año
A la fecha de observación
Valor
Cambio absoluto
El cambio con respecto al valor anterior
1 ene 1962 año
12.705
+12.705
0.0%
1 ene 1963 año
10.114
-2.591
-20.39%
1 ene 1964 año
15.386
+5.272
52.12%
1 ene 1965 año
15.25
-0.136
-0.88%
1 ene 1966 año
21.179
+5.928
38.87%
1 ene 1967 año
-0.476
-21.654
-102.25%
1 ene 1968 año
7.14
+7.616
-1.6 mil%
1 ene 1969 año
10.342
+3.202
44.84%
1 ene 1970 año
15.487
+5.145
49.75%
1 ene 1971 año
6.165
-9.322
-60.19%
1 ene 1972 año
7.885
+1.72
27.9%
1 ene 1973 año
14.3
+6.415
81.35%
1 ene 1974 año
33.633
+19.333
135.2%
1 ene 1975 año
-14.922
-48.554
-144.37%
1 ene 1976 año
1.476
+16.398
-109.89%
1 ene 1977 año
9.588
+8.112
549.46%
1 ene 1978 año
10.115
+0.527
5.49%
1 ene 1979 año
4.535
-5.58
-55.17%
1 ene 1980 año
9.723
+5.188
114.42%
1 ene 1981 año
9.336
-0.387
-3.98%
1 ene 1982 año
6.46
-2.876
-30.81%
1 ene 1983 año
-2.606
-9.066
-140.34%
1 ene 1984 año
2.575
+5.181
-198.81%
1 ene 1985 año
-2.122
-4.697
-182.43%
1 ene 1986 año
4.43
+6.553
-308.74%
1 ene 1987 año
13.877
+9.447
213.22%
1 ene 1988 año
2.14
-11.737
-84.58%
1 ene 1989 año
7.336
+5.196
242.77%
1 ene 1990 año
10.472
+3.136
42.76%
1 ene 1991 año
8.366
-2.106
-20.11%
1 ene 1992 año
5.837
-2.529
-30.23%
1 ene 1993 año
1.077
-4.76
-81.55%
1 ene 1994 año
0.628
-0.449
-41.67%
1 ene 1995 año
1.5
+0.872
138.86%
1 ene 1996 año
8.945
+7.445
496.22%
1 ene 1997 año
9.936
+0.991
11.08%
1 ene 1998 año
8.438
-1.498
-15.08%
1 ene 1999 año
18.162
+9.724
115.24%
1 ene 2000 año
14.486
-3.676
-20.24%
1 ene 2001 año
20.18
+5.694
39.31%
1 ene 2002 año
0.991
-19.189
-95.09%
1 ene 2003 año
-3.432
-4.424
-446.18%
1 ene 2004 año
7.393
+10.826
-315.41%
1 ene 2005 año
4.418
-2.976
-40.25%
1 ene 2006 año
0.854
-3.563
-80.67%
1 ene 2007 año
13.31
+12.456
1.46 mil%
1 ene 2008 año
15.499
+2.19
16.45%
1 ene 2009 año
1.321
-14.179
-91.48%
1 ene 2010 año
-20.354
-21.675
-1.64 mil%
1 ene 2011 año
-3.431
+16.923
-83.15%
1 ene 2012 año
-9.449
-6.018
175.42%
1 ene 2013 año
-9.099
+0.349
-3.7%
1 ene 2014 año
-2.392
+6.707
-73.71%
1 ene 2015 año
7.562
+9.954
-416.09%
1 ene 2016 año
0.31
-7.252
-95.9%
Ranking de los países por los datos estadísticos actuales


Comentarios: