29
/de/
de
AIzaSyAYiBZKx7MnpbEhh9jyipgxe19OcubqV5w
April 1, 2024
93325
Bulgaria
BGR
true
2
1
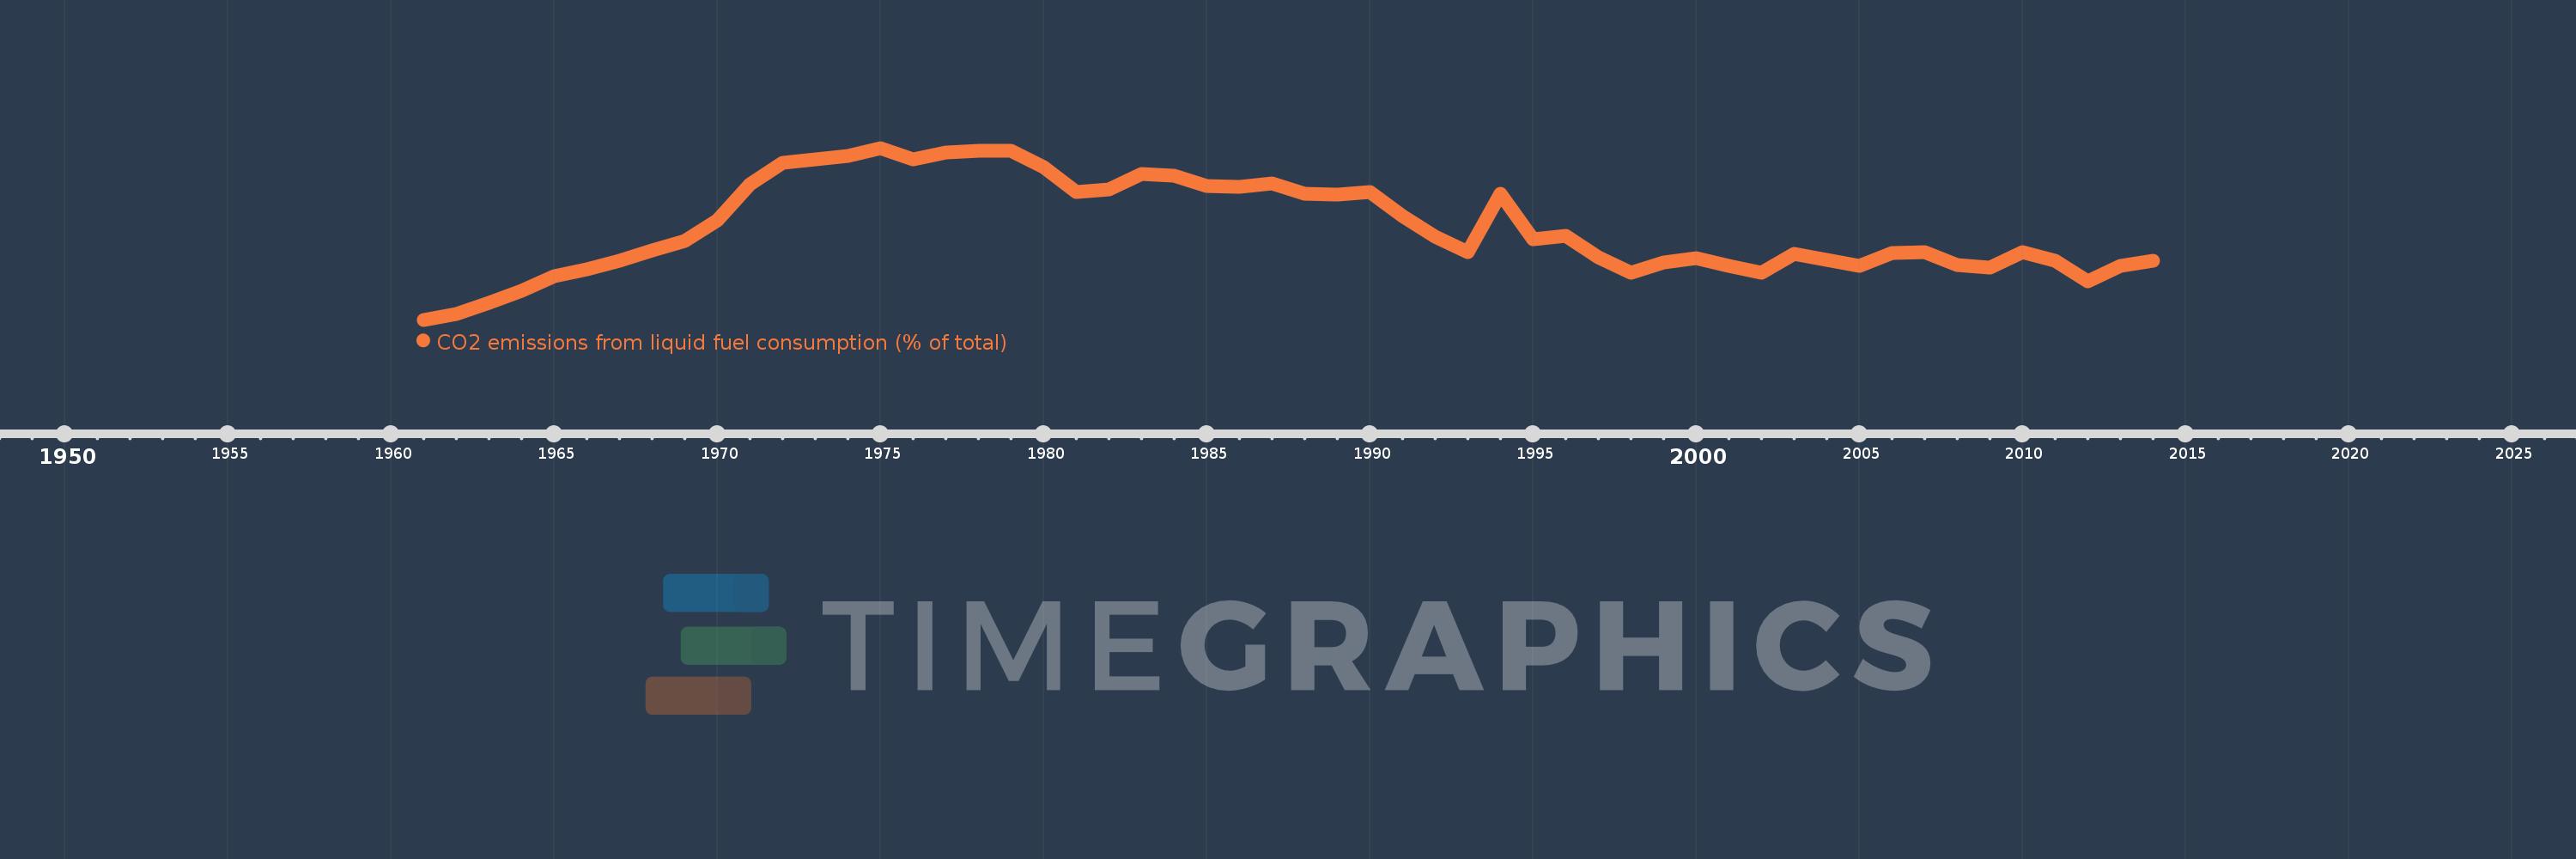
CO2 emissions from liquid fuel consumption (% of total)
2014,2013,2012,2011,2010,2009,2008,2007,2006,2005,2004,2003,2002,2001,2000,1999,1998,1997,1996,1995,1994,1993,1992,1991,1990,1989,1988,1987,1986,1985,1984,1983,1982,1981,1980,1979,1978,1977,1976,1975,1974,1973,1972,1971,1970,1969,1968,1967,1966,1965,1964,1963,1962,1961
Diese Statistik in anderen Ländern:
AfghanistanAlbaniaAlgeriaAndorraAngolaAntigua and BarbudaArab WorldArgentinaArmeniaArubaAustraliaAustriaAzerbaijanBahamas, TheBahrainBangladeshBarbadosBelarusBelgiumBelizeBeninBermudaBhutanBoliviaBosnia and HerzegovinaBotswanaBrazilBritish Virgin IslandsBrunei DarussalamBulgariaBurkina FasoBurundiCabo VerdeCambodiaCameroonCanadaCaribbean small statesCayman IslandsCentral African RepublicCentral Europe and the BalticsChadChileChinaColombiaComorosCongo, Dem. Rep.Congo, Rep.Costa RicaCote d'IvoireCroatiaCubaCuracaoCyprusCzech RepublicDenmarkDjiboutiDominicaDominican RepublicEarly-demographic dividendEast Asia & PacificEast Asia & Pacific (excluding high income)East Asia & Pacific (IDA & IBRD countries)EcuadorEgypt, Arab Rep.El SalvadorEquatorial GuineaEritreaEstoniaEthiopiaEuro areaEurope & Central AsiaEurope & Central Asia (excluding high income)Europe & Central Asia (IDA & IBRD countries)European UnionFaroe IslandsFijiFinlandFragile and conflict affected situationsFranceFrench PolynesiaGabonGambia, TheGeorgiaGermanyGhanaGibraltarGreeceGreenlandGrenadaGuatemalaGuineaGuinea-BissauGuyanaHaitiHeavily indebted poor countries (HIPC)High incomeHondurasHong Kong SAR, ChinaHungaryIBRD onlyIcelandIDA & IBRD totalIDA blendIDA onlyIDA totalIndiaIndonesiaIran, Islamic Rep.IraqIrelandIsraelItalyJamaicaJapanJordanKazakhstanKenyaKiribatiKorea, Dem. People’s Rep.Korea, Rep.KuwaitKyrgyz RepublicLao PDRLate-demographic dividendLatin America & Caribbean Latin America & Caribbean (excluding high income)Latin America & the Caribbean (IDA & IBRD countries)LatviaLeast developed countries: UN classificationLebanonLesothoLiberiaLibyaLiechtensteinLithuaniaLow & middle incomeLow incomeLower middle incomeLuxembourgMacao SAR, ChinaMacedonia, FYRMadagascarMalawiMalaysiaMaldivesMaliMaltaMarshall IslandsMauritaniaMauritiusMexicoMicronesia, Fed. Sts.Middle East & North AfricaMiddle East & North Africa (excluding high income)Middle East & North Africa (IDA & IBRD countries)Middle incomeMoldovaMongoliaMontenegroMoroccoMozambiqueMyanmarNamibiaNauruNepalNetherlandsNew CaledoniaNew ZealandNicaraguaNigerNigeriaNorth AmericaNorwayOECD membersOmanOther small statesPacific island small statesPakistanPalauPanamaPapua New GuineaParaguayPeruPhilippinesPolandPortugalPost-demographic dividendPre-demographic dividendQatarRomaniaRussian FederationRwandaSamoaSao Tome and PrincipeSaudi ArabiaSenegalSerbiaSeychellesSierra LeoneSingaporeSint Maarten (Dutch part)Slovak RepublicSloveniaSmall statesSolomon IslandsSomaliaSouth AfricaSouth AsiaSouth Asia (IDA & IBRD)South SudanSpainSri LankaSt. Kitts and NevisSt. LuciaSt. Vincent and the GrenadinesSub-Saharan Africa Sub-Saharan Africa (excluding high income)Sub-Saharan Africa (IDA & IBRD countries)SudanSurinameSwazilandSwedenSwitzerlandSyrian Arab RepublicTajikistanTanzaniaThailandTimor-LesteTogoTongaTrinidad and TobagoTunisiaTurkeyTurkmenistanTurks and Caicos IslandsUgandaUkraineUnited Arab EmiratesUnited KingdomUnited StatesUpper middle incomeUruguayUzbekistanVanuatuVenezuela, RBVietnamWest Bank and GazaWorldYemen, Rep.ZambiaZimbabwe Zeitlinie:
Diese Zeitleiste vorliegt die Graphik ab 1961 J. bis 2014 J. Bulgaria. Die Angaben bis 1960 J. sind nicht vorhanden. Die Zahl aktueller Beobachtungen nach Daten: 54.
Die Quelle (Bezeichnung):
Kennzahlen der Weltentwicklung
Die Quelle (Einrichtung):
Carbon Dioxide Information Analysis Center, Environmental Sciences Division, Oak Ridge National Laboratory, Tennessee, United States.
Kategorien:
Climate Change, Environment
Es wurde aktualisiert:
23 Apr 2017 Jahr
Kennzahlen der Wertänderungen vom Jahr zum Jahr
Minimum:
12.829
1 Jan 1961 Jahr
Maximum:
49.277
1 Jan 1975 Jahr
Zum Datum der Beobachtung
Wert
Absolute Veränderung
Die Veränderung bezüglich dem vorherigen Wert
1 Jan 1961 Jahr
12.829
+12.829
0.0%
1 Jan 1962 Jahr
14.062
+1.233
9.61%
1 Jan 1963 Jahr
16.416
+2.354
16.74%
1 Jan 1964 Jahr
18.905
+2.488
15.16%
1 Jan 1965 Jahr
22.004
+3.099
16.39%
1 Jan 1966 Jahr
23.561
+1.557
7.08%
1 Jan 1967 Jahr
25.393
+1.832
7.77%
1 Jan 1968 Jahr
27.539
+2.146
8.45%
1 Jan 1969 Jahr
29.52
+1.981
7.19%
1 Jan 1970 Jahr
33.937
+4.417
14.96%
1 Jan 1971 Jahr
41.533
+7.596
22.38%
1 Jan 1972 Jahr
46.079
+4.546
10.95%
1 Jan 1973 Jahr
46.855
+0.776
1.68%
1 Jan 1974 Jahr
47.653
+0.798
1.7%
1 Jan 1975 Jahr
49.277
+1.624
3.41%
1 Jan 1976 Jahr
46.858
-2.419
-4.91%
1 Jan 1977 Jahr
48.292
+1.434
3.06%
1 Jan 1978 Jahr
48.733
+0.441
0.91%
1 Jan 1979 Jahr
48.673
-0.059
-0.12%
1 Jan 1980 Jahr
45.217
-3.457
-7.1%
1 Jan 1981 Jahr
39.956
-5.261
-11.64%
1 Jan 1982 Jahr
40.534
+0.578
1.45%
1 Jan 1983 Jahr
43.753
+3.219
7.94%
1 Jan 1984 Jahr
43.473
-0.28
-0.64%
1 Jan 1985 Jahr
41.238
-2.235
-5.14%
1 Jan 1986 Jahr
41.109
-0.129
-0.31%
1 Jan 1987 Jahr
41.739
+0.63
1.53%
1 Jan 1988 Jahr
39.613
-2.125
-5.09%
1 Jan 1989 Jahr
39.313
-0.301
-0.76%
1 Jan 1990 Jahr
39.917
+0.604
1.54%
1 Jan 1991 Jahr
34.795
-5.122
-12.83%
1 Jan 1992 Jahr
30.369
-4.426
-12.72%
1 Jan 1993 Jahr
27.103
-3.266
-10.76%
1 Jan 1994 Jahr
39.628
+12.526
46.22%
1 Jan 1995 Jahr
29.818
-9.811
-24.76%
1 Jan 1996 Jahr
30.573
+0.755
2.53%
1 Jan 1997 Jahr
26.122
-4.451
-14.56%
1 Jan 1998 Jahr
22.72
-3.402
-13.02%
1 Jan 1999 Jahr
24.906
+2.187
9.63%
1 Jan 2000 Jahr
25.913
+1.007
4.04%
1 Jan 2001 Jahr
24.227
-1.686
-6.51%
1 Jan 2002 Jahr
22.719
-1.508
-6.23%
1 Jan 2003 Jahr
26.758
+4.039
17.78%
1 Jan 2004 Jahr
25.455
-1.303
-4.87%
1 Jan 2005 Jahr
24.328
-1.127
-4.43%
1 Jan 2006 Jahr
26.984
+2.656
10.92%
1 Jan 2007 Jahr
27.141
+0.157
0.58%
1 Jan 2008 Jahr
24.4
-2.741
-10.1%
1 Jan 2009 Jahr
23.892
-0.508
-2.08%
1 Jan 2010 Jahr
27.159
+3.267
13.67%
1 Jan 2011 Jahr
25.285
-1.875
-6.9%
1 Jan 2012 Jahr
20.972
-4.313
-17.06%
1 Jan 2013 Jahr
24.344
+3.372
16.08%
1 Jan 2014 Jahr
25.294
+0.95
3.9%
Bewertung der Länder gemäß mit laufender Statistik nach Jahren


Kommentare: