29
/de/
de
AIzaSyAYiBZKx7MnpbEhh9jyipgxe19OcubqV5w
April 1, 2024
41282
Latin America & Caribbean
LCN
false
2
1
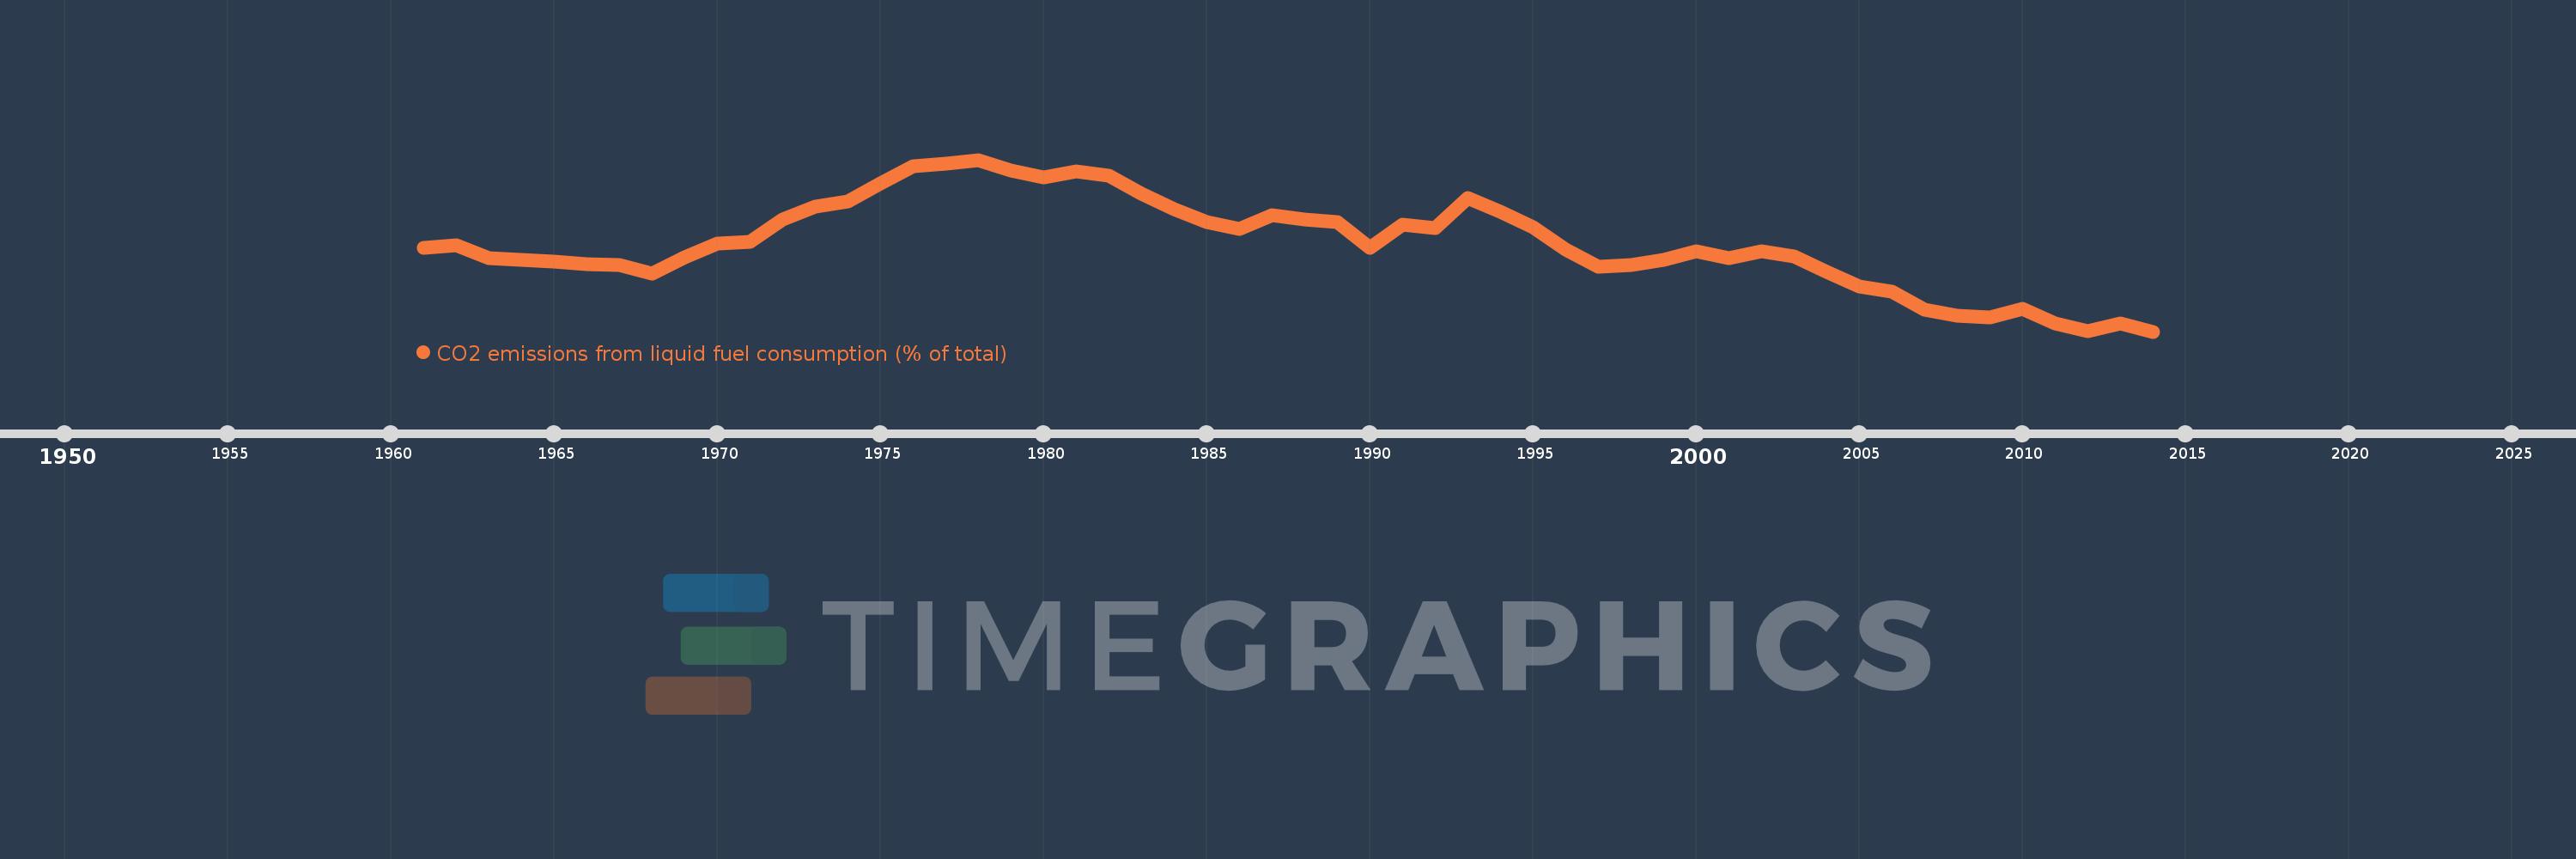
CO2 emissions from liquid fuel consumption (% of total)
2014,2013,2012,2011,2010,2009,2008,2007,2006,2005,2004,2003,2002,2001,2000,1999,1998,1997,1996,1995,1994,1993,1992,1991,1990,1989,1988,1987,1986,1985,1984,1983,1982,1981,1980,1979,1978,1977,1976,1975,1974,1973,1972,1971,1970,1969,1968,1967,1966,1965,1964,1963,1962,1961
Diese Statistik in anderen Ländern:
AfghanistanAlbaniaAlgeriaAndorraAngolaAntigua and BarbudaArab WorldArgentinaArmeniaArubaAustraliaAustriaAzerbaijanBahamas, TheBahrainBangladeshBarbadosBelarusBelgiumBelizeBeninBermudaBhutanBoliviaBosnia and HerzegovinaBotswanaBrazilBritish Virgin IslandsBrunei DarussalamBulgariaBurkina FasoBurundiCabo VerdeCambodiaCameroonCanadaCaribbean small statesCayman IslandsCentral African RepublicCentral Europe and the BalticsChadChileChinaColombiaComorosCongo, Dem. Rep.Congo, Rep.Costa RicaCote d'IvoireCroatiaCubaCuracaoCyprusCzech RepublicDenmarkDjiboutiDominicaDominican RepublicEarly-demographic dividendEast Asia & PacificEast Asia & Pacific (excluding high income)East Asia & Pacific (IDA & IBRD countries)EcuadorEgypt, Arab Rep.El SalvadorEquatorial GuineaEritreaEstoniaEthiopiaEuro areaEurope & Central AsiaEurope & Central Asia (excluding high income)Europe & Central Asia (IDA & IBRD countries)European UnionFaroe IslandsFijiFinlandFragile and conflict affected situationsFranceFrench PolynesiaGabonGambia, TheGeorgiaGermanyGhanaGibraltarGreeceGreenlandGrenadaGuatemalaGuineaGuinea-BissauGuyanaHaitiHeavily indebted poor countries (HIPC)High incomeHondurasHong Kong SAR, ChinaHungaryIBRD onlyIcelandIDA & IBRD totalIDA blendIDA onlyIDA totalIndiaIndonesiaIran, Islamic Rep.IraqIrelandIsraelItalyJamaicaJapanJordanKazakhstanKenyaKiribatiKorea, Dem. People’s Rep.Korea, Rep.KuwaitKyrgyz RepublicLao PDRLate-demographic dividendLatin America & Caribbean Latin America & Caribbean (excluding high income)Latin America & the Caribbean (IDA & IBRD countries)LatviaLeast developed countries: UN classificationLebanonLesothoLiberiaLibyaLiechtensteinLithuaniaLow & middle incomeLow incomeLower middle incomeLuxembourgMacao SAR, ChinaMacedonia, FYRMadagascarMalawiMalaysiaMaldivesMaliMaltaMarshall IslandsMauritaniaMauritiusMexicoMicronesia, Fed. Sts.Middle East & North AfricaMiddle East & North Africa (excluding high income)Middle East & North Africa (IDA & IBRD countries)Middle incomeMoldovaMongoliaMontenegroMoroccoMozambiqueMyanmarNamibiaNauruNepalNetherlandsNew CaledoniaNew ZealandNicaraguaNigerNigeriaNorth AmericaNorwayOECD membersOmanOther small statesPacific island small statesPakistanPalauPanamaPapua New GuineaParaguayPeruPhilippinesPolandPortugalPost-demographic dividendPre-demographic dividendQatarRomaniaRussian FederationRwandaSamoaSao Tome and PrincipeSaudi ArabiaSenegalSerbiaSeychellesSierra LeoneSingaporeSint Maarten (Dutch part)Slovak RepublicSloveniaSmall statesSolomon IslandsSomaliaSouth AfricaSouth AsiaSouth Asia (IDA & IBRD)South SudanSpainSri LankaSt. Kitts and NevisSt. LuciaSt. Vincent and the GrenadinesSub-Saharan Africa Sub-Saharan Africa (excluding high income)Sub-Saharan Africa (IDA & IBRD countries)SudanSurinameSwazilandSwedenSwitzerlandSyrian Arab RepublicTajikistanTanzaniaThailandTimor-LesteTogoTongaTrinidad and TobagoTunisiaTurkeyTurkmenistanTurks and Caicos IslandsUgandaUkraineUnited Arab EmiratesUnited KingdomUnited StatesUpper middle incomeUruguayUzbekistanVanuatuVenezuela, RBVietnamWest Bank and GazaWorldYemen, Rep.ZambiaZimbabwe Zeitlinie:
Diese Zeitleiste vorliegt die Graphik ab 1961 J. bis 2014 J. Latin America & Caribbean . Die Angaben bis 1960 J. sind nicht vorhanden. Die Zahl aktueller Beobachtungen nach Daten: 54.
Die Quelle (Bezeichnung):
Kennzahlen der Weltentwicklung
Die Quelle (Einrichtung):
Carbon Dioxide Information Analysis Center, Environmental Sciences Division, Oak Ridge National Laboratory, Tennessee, United States.
Kategorien:
Climate Change, Environment
Es wurde aktualisiert:
23 Apr 2017 Jahr
Kennzahlen der Wertänderungen vom Jahr zum Jahr
Minimum:
59.199
1 Jan 2014 Jahr
Maximum:
73.957
1 Jan 1978 Jahr
Zum Datum der Beobachtung
Wert
Absolute Veränderung
Die Veränderung bezüglich dem vorherigen Wert
1 Jan 1961 Jahr
66.415
+66.415
0.0%
1 Jan 1962 Jahr
66.587
+0.172
0.26%
1 Jan 1963 Jahr
65.478
-1.11
-1.67%
1 Jan 1964 Jahr
65.356
-0.122
-0.19%
1 Jan 1965 Jahr
65.184
-0.172
-0.26%
1 Jan 1966 Jahr
64.97
-0.214
-0.33%
1 Jan 1967 Jahr
64.905
-0.065
-0.1%
1 Jan 1968 Jahr
64.164
-0.741
-1.14%
1 Jan 1969 Jahr
65.572
+1.408
2.19%
1 Jan 1970 Jahr
66.746
+1.174
1.79%
1 Jan 1971 Jahr
66.876
+0.13
0.19%
1 Jan 1972 Jahr
68.817
+1.941
2.9%
1 Jan 1973 Jahr
69.958
+1.141
1.66%
1 Jan 1974 Jahr
70.375
+0.416
0.6%
1 Jan 1975 Jahr
71.908
+1.533
2.18%
1 Jan 1976 Jahr
73.401
+1.493
2.08%
1 Jan 1977 Jahr
73.62
+0.219
0.3%
1 Jan 1978 Jahr
73.957
+0.337
0.46%
1 Jan 1979 Jahr
73.032
-0.925
-1.25%
1 Jan 1980 Jahr
72.41
-0.621
-0.85%
1 Jan 1981 Jahr
72.974
+0.564
0.78%
1 Jan 1982 Jahr
72.621
-0.353
-0.48%
1 Jan 1983 Jahr
71.068
-1.553
-2.14%
1 Jan 1984 Jahr
69.708
-1.36
-1.91%
1 Jan 1985 Jahr
68.598
-1.11
-1.59%
1 Jan 1986 Jahr
68.021
-0.577
-0.84%
1 Jan 1987 Jahr
69.173
+1.152
1.69%
1 Jan 1988 Jahr
68.82
-0.353
-0.51%
1 Jan 1989 Jahr
68.605
-0.215
-0.31%
1 Jan 1990 Jahr
66.373
-2.232
-3.25%
1 Jan 1991 Jahr
68.382
+2.009
3.03%
1 Jan 1992 Jahr
68.1
-0.282
-0.41%
1 Jan 1993 Jahr
70.651
+2.551
3.75%
1 Jan 1994 Jahr
69.529
-1.121
-1.59%
1 Jan 1995 Jahr
68.131
-1.399
-2.01%
1 Jan 1996 Jahr
66.23
-1.9
-2.79%
1 Jan 1997 Jahr
64.764
-1.466
-2.21%
1 Jan 1998 Jahr
64.949
+0.185
0.29%
1 Jan 1999 Jahr
65.368
+0.419
0.65%
1 Jan 2000 Jahr
66.097
+0.729
1.12%
1 Jan 2001 Jahr
65.492
-0.606
-0.92%
1 Jan 2002 Jahr
66.082
+0.59
0.9%
1 Jan 2003 Jahr
65.647
-0.435
-0.66%
1 Jan 2004 Jahr
64.35
-1.297
-1.98%
1 Jan 2005 Jahr
63.085
-1.265
-1.97%
1 Jan 2006 Jahr
62.653
-0.432
-0.68%
1 Jan 2007 Jahr
61.089
-1.564
-2.5%
1 Jan 2008 Jahr
60.583
-0.506
-0.83%
1 Jan 2009 Jahr
60.387
-0.196
-0.32%
1 Jan 2010 Jahr
61.159
+0.772
1.28%
1 Jan 2011 Jahr
59.92
-1.239
-2.03%
1 Jan 2012 Jahr
59.27
-0.65
-1.08%
1 Jan 2013 Jahr
59.877
+0.607
1.02%
1 Jan 2014 Jahr
59.199
-0.678
-1.13%
Bewertung der Länder gemäß mit laufender Statistik nach Jahren


Kommentare: