29
/de/
de
AIzaSyAYiBZKx7MnpbEhh9jyipgxe19OcubqV5w
April 1, 2024
72781
Australia
AUS
true
2
1
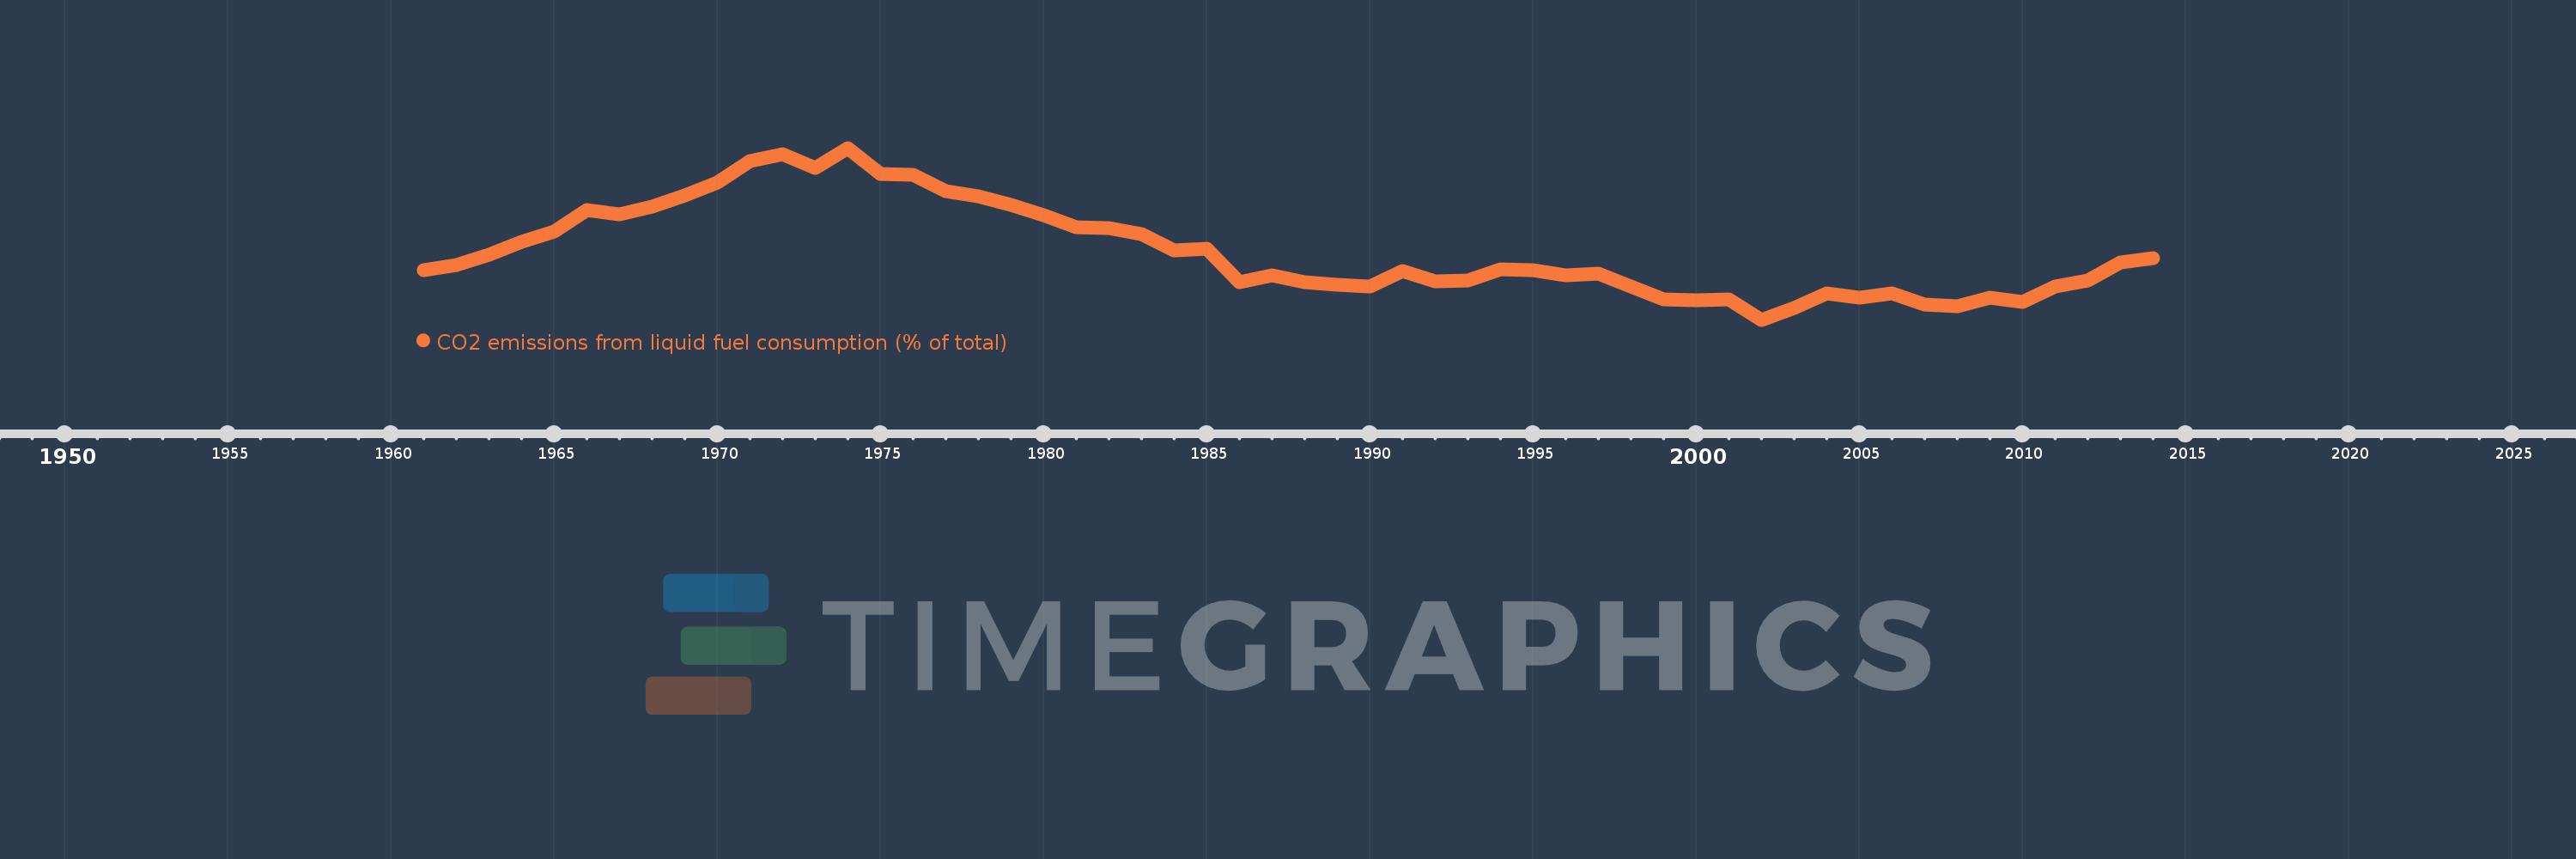
CO2 emissions from liquid fuel consumption (% of total)
2014,2013,2012,2011,2010,2009,2008,2007,2006,2005,2004,2003,2002,2001,2000,1999,1998,1997,1996,1995,1994,1993,1992,1991,1990,1989,1988,1987,1986,1985,1984,1983,1982,1981,1980,1979,1978,1977,1976,1975,1974,1973,1972,1971,1970,1969,1968,1967,1966,1965,1964,1963,1962,1961
Diese Statistik in anderen Ländern:
AfghanistanAlbaniaAlgeriaAndorraAngolaAntigua and BarbudaArab WorldArgentinaArmeniaArubaAustraliaAustriaAzerbaijanBahamas, TheBahrainBangladeshBarbadosBelarusBelgiumBelizeBeninBermudaBhutanBoliviaBosnia and HerzegovinaBotswanaBrazilBritish Virgin IslandsBrunei DarussalamBulgariaBurkina FasoBurundiCabo VerdeCambodiaCameroonCanadaCaribbean small statesCayman IslandsCentral African RepublicCentral Europe and the BalticsChadChileChinaColombiaComorosCongo, Dem. Rep.Congo, Rep.Costa RicaCote d'IvoireCroatiaCubaCuracaoCyprusCzech RepublicDenmarkDjiboutiDominicaDominican RepublicEarly-demographic dividendEast Asia & PacificEast Asia & Pacific (excluding high income)East Asia & Pacific (IDA & IBRD countries)EcuadorEgypt, Arab Rep.El SalvadorEquatorial GuineaEritreaEstoniaEthiopiaEuro areaEurope & Central AsiaEurope & Central Asia (excluding high income)Europe & Central Asia (IDA & IBRD countries)European UnionFaroe IslandsFijiFinlandFragile and conflict affected situationsFranceFrench PolynesiaGabonGambia, TheGeorgiaGermanyGhanaGibraltarGreeceGreenlandGrenadaGuatemalaGuineaGuinea-BissauGuyanaHaitiHeavily indebted poor countries (HIPC)High incomeHondurasHong Kong SAR, ChinaHungaryIBRD onlyIcelandIDA & IBRD totalIDA blendIDA onlyIDA totalIndiaIndonesiaIran, Islamic Rep.IraqIrelandIsraelItalyJamaicaJapanJordanKazakhstanKenyaKiribatiKorea, Dem. People’s Rep.Korea, Rep.KuwaitKyrgyz RepublicLao PDRLate-demographic dividendLatin America & Caribbean Latin America & Caribbean (excluding high income)Latin America & the Caribbean (IDA & IBRD countries)LatviaLeast developed countries: UN classificationLebanonLesothoLiberiaLibyaLiechtensteinLithuaniaLow & middle incomeLow incomeLower middle incomeLuxembourgMacao SAR, ChinaMacedonia, FYRMadagascarMalawiMalaysiaMaldivesMaliMaltaMarshall IslandsMauritaniaMauritiusMexicoMicronesia, Fed. Sts.Middle East & North AfricaMiddle East & North Africa (excluding high income)Middle East & North Africa (IDA & IBRD countries)Middle incomeMoldovaMongoliaMontenegroMoroccoMozambiqueMyanmarNamibiaNauruNepalNetherlandsNew CaledoniaNew ZealandNicaraguaNigerNigeriaNorth AmericaNorwayOECD membersOmanOther small statesPacific island small statesPakistanPalauPanamaPapua New GuineaParaguayPeruPhilippinesPolandPortugalPost-demographic dividendPre-demographic dividendQatarRomaniaRussian FederationRwandaSamoaSao Tome and PrincipeSaudi ArabiaSenegalSerbiaSeychellesSierra LeoneSingaporeSint Maarten (Dutch part)Slovak RepublicSloveniaSmall statesSolomon IslandsSomaliaSouth AfricaSouth AsiaSouth Asia (IDA & IBRD)South SudanSpainSri LankaSt. Kitts and NevisSt. LuciaSt. Vincent and the GrenadinesSub-Saharan Africa Sub-Saharan Africa (excluding high income)Sub-Saharan Africa (IDA & IBRD countries)SudanSurinameSwazilandSwedenSwitzerlandSyrian Arab RepublicTajikistanTanzaniaThailandTimor-LesteTogoTongaTrinidad and TobagoTunisiaTurkeyTurkmenistanTurks and Caicos IslandsUgandaUkraineUnited Arab EmiratesUnited KingdomUnited StatesUpper middle incomeUruguayUzbekistanVanuatuVenezuela, RBVietnamWest Bank and GazaWorldYemen, Rep.ZambiaZimbabwe Zeitlinie:
Diese Zeitleiste vorliegt die Graphik ab 1961 J. bis 2014 J. Australia. Die Angaben bis 1960 J. sind nicht vorhanden. Die Zahl aktueller Beobachtungen nach Daten: 54.
Die Quelle (Bezeichnung):
Kennzahlen der Weltentwicklung
Die Quelle (Einrichtung):
Carbon Dioxide Information Analysis Center, Environmental Sciences Division, Oak Ridge National Laboratory, Tennessee, United States.
Kategorien:
Climate Change, Environment
Es wurde aktualisiert:
23 Apr 2017 Jahr
Kennzahlen der Wertänderungen vom Jahr zum Jahr
Minimum:
24.812
1 Jan 2002 Jahr
Maximum:
48.016
1 Jan 1974 Jahr
Zum Datum der Beobachtung
Wert
Absolute Veränderung
Die Veränderung bezüglich dem vorherigen Wert
1 Jan 1961 Jahr
31.555
+31.555
0.0%
1 Jan 1962 Jahr
32.165
+0.61
1.93%
1 Jan 1963 Jahr
33.621
+1.456
4.53%
1 Jan 1964 Jahr
35.324
+1.703
5.07%
1 Jan 1965 Jahr
36.684
+1.36
3.85%
1 Jan 1966 Jahr
39.636
+2.952
8.05%
1 Jan 1967 Jahr
39.086
-0.55
-1.39%
1 Jan 1968 Jahr
40.138
+1.052
2.69%
1 Jan 1969 Jahr
41.602
+1.464
3.65%
1 Jan 1970 Jahr
43.288
+1.685
4.05%
1 Jan 1971 Jahr
46.242
+2.954
6.82%
1 Jan 1972 Jahr
47.136
+0.895
1.94%
1 Jan 1973 Jahr
45.321
-1.816
-3.85%
1 Jan 1974 Jahr
48.016
+2.695
5.95%
1 Jan 1975 Jahr
44.543
-3.474
-7.23%
1 Jan 1976 Jahr
44.344
-0.199
-0.45%
1 Jan 1977 Jahr
42.189
-2.155
-4.86%
1 Jan 1978 Jahr
41.515
-0.674
-1.6%
1 Jan 1979 Jahr
40.367
-1.149
-2.77%
1 Jan 1980 Jahr
38.891
-1.476
-3.66%
1 Jan 1981 Jahr
37.279
-1.612
-4.15%
1 Jan 1982 Jahr
37.222
-0.056
-0.15%
1 Jan 1983 Jahr
36.363
-0.859
-2.31%
1 Jan 1984 Jahr
34.2
-2.163
-5.95%
1 Jan 1985 Jahr
34.436
+0.235
0.69%
1 Jan 1986 Jahr
29.834
-4.602
-13.36%
1 Jan 1987 Jahr
30.841
+1.007
3.38%
1 Jan 1988 Jahr
29.836
-1.005
-3.26%
1 Jan 1989 Jahr
29.589
-0.247
-0.83%
1 Jan 1990 Jahr
29.342
-0.248
-0.84%
1 Jan 1991 Jahr
31.399
+2.057
7.01%
1 Jan 1992 Jahr
30.05
-1.349
-4.3%
1 Jan 1993 Jahr
30.133
+0.083
0.27%
1 Jan 1994 Jahr
31.58
+1.447
4.8%
1 Jan 1995 Jahr
31.531
-0.049
-0.16%
1 Jan 1996 Jahr
30.77
-0.761
-2.41%
1 Jan 1997 Jahr
31.059
+0.289
0.94%
1 Jan 1998 Jahr
29.247
-1.813
-5.84%
1 Jan 1999 Jahr
27.516
-1.731
-5.92%
1 Jan 2000 Jahr
27.401
-0.115
-0.42%
1 Jan 2001 Jahr
27.618
+0.217
0.79%
1 Jan 2002 Jahr
24.812
-2.806
-10.16%
1 Jan 2003 Jahr
26.349
+1.537
6.2%
1 Jan 2004 Jahr
28.409
+2.06
7.82%
1 Jan 2005 Jahr
27.759
-0.651
-2.29%
1 Jan 2006 Jahr
28.391
+0.632
2.28%
1 Jan 2007 Jahr
26.865
-1.525
-5.37%
1 Jan 2008 Jahr
26.617
-0.248
-0.92%
1 Jan 2009 Jahr
27.747
+1.13
4.25%
1 Jan 2010 Jahr
27.22
-0.527
-1.9%
1 Jan 2011 Jahr
29.285
+2.065
7.59%
1 Jan 2012 Jahr
30.148
+0.863
2.95%
1 Jan 2013 Jahr
32.601
+2.453
8.14%
1 Jan 2014 Jahr
33.103
+0.503
1.54%
Bewertung der Länder gemäß mit laufender Statistik nach Jahren


Kommentare: