29
/de/
de
AIzaSyAYiBZKx7MnpbEhh9jyipgxe19OcubqV5w
April 1, 2024
225699
Portugal
PRT
true
2
1
CO2 emissions from liquid fuel consumption (% of total)
2014,2013,2012,2011,2010,2009,2008,2007,2006,2005,2004,2003,2002,2001,2000,1999,1998,1997,1996,1995,1994,1993,1992,1991,1990,1989,1988,1987,1986,1985,1984,1983,1982,1981,1980,1979,1978,1977,1976,1975,1974,1973,1972,1971,1970,1969,1968,1967,1966,1965,1964,1963,1962,1961
Diese Statistik in anderen Ländern:
AfghanistanAlbaniaAlgeriaAndorraAngolaAntigua and BarbudaArab WorldArgentinaArmeniaArubaAustraliaAustriaAzerbaijanBahamas, TheBahrainBangladeshBarbadosBelarusBelgiumBelizeBeninBermudaBhutanBoliviaBosnia and HerzegovinaBotswanaBrazilBritish Virgin IslandsBrunei DarussalamBulgariaBurkina FasoBurundiCabo VerdeCambodiaCameroonCanadaCaribbean small statesCayman IslandsCentral African RepublicCentral Europe and the BalticsChadChileChinaColombiaComorosCongo, Dem. Rep.Congo, Rep.Costa RicaCote d'IvoireCroatiaCubaCuracaoCyprusCzech RepublicDenmarkDjiboutiDominicaDominican RepublicEarly-demographic dividendEast Asia & PacificEast Asia & Pacific (excluding high income)East Asia & Pacific (IDA & IBRD countries)EcuadorEgypt, Arab Rep.El SalvadorEquatorial GuineaEritreaEstoniaEthiopiaEuro areaEurope & Central AsiaEurope & Central Asia (excluding high income)Europe & Central Asia (IDA & IBRD countries)European UnionFaroe IslandsFijiFinlandFragile and conflict affected situationsFranceFrench PolynesiaGabonGambia, TheGeorgiaGermanyGhanaGibraltarGreeceGreenlandGrenadaGuatemalaGuineaGuinea-BissauGuyanaHaitiHeavily indebted poor countries (HIPC)High incomeHondurasHong Kong SAR, ChinaHungaryIBRD onlyIcelandIDA & IBRD totalIDA blendIDA onlyIDA totalIndiaIndonesiaIran, Islamic Rep.IraqIrelandIsraelItalyJamaicaJapanJordanKazakhstanKenyaKiribatiKorea, Dem. People’s Rep.Korea, Rep.KuwaitKyrgyz RepublicLao PDRLate-demographic dividendLatin America & Caribbean Latin America & Caribbean (excluding high income)Latin America & the Caribbean (IDA & IBRD countries)LatviaLeast developed countries: UN classificationLebanonLesothoLiberiaLibyaLiechtensteinLithuaniaLow & middle incomeLow incomeLower middle incomeLuxembourgMacao SAR, ChinaMacedonia, FYRMadagascarMalawiMalaysiaMaldivesMaliMaltaMarshall IslandsMauritaniaMauritiusMexicoMicronesia, Fed. Sts.Middle East & North AfricaMiddle East & North Africa (excluding high income)Middle East & North Africa (IDA & IBRD countries)Middle incomeMoldovaMongoliaMontenegroMoroccoMozambiqueMyanmarNamibiaNauruNepalNetherlandsNew CaledoniaNew ZealandNicaraguaNigerNigeriaNorth AmericaNorwayOECD membersOmanOther small statesPacific island small statesPakistanPalauPanamaPapua New GuineaParaguayPeruPhilippinesPolandPortugalPost-demographic dividendPre-demographic dividendQatarRomaniaRussian FederationRwandaSamoaSao Tome and PrincipeSaudi ArabiaSenegalSerbiaSeychellesSierra LeoneSingaporeSint Maarten (Dutch part)Slovak RepublicSloveniaSmall statesSolomon IslandsSomaliaSouth AfricaSouth AsiaSouth Asia (IDA & IBRD)South SudanSpainSri LankaSt. Kitts and NevisSt. LuciaSt. Vincent and the GrenadinesSub-Saharan Africa Sub-Saharan Africa (excluding high income)Sub-Saharan Africa (IDA & IBRD countries)SudanSurinameSwazilandSwedenSwitzerlandSyrian Arab RepublicTajikistanTanzaniaThailandTimor-LesteTogoTongaTrinidad and TobagoTunisiaTurkeyTurkmenistanTurks and Caicos IslandsUgandaUkraineUnited Arab EmiratesUnited KingdomUnited StatesUpper middle incomeUruguayUzbekistanVanuatuVenezuela, RBVietnamWest Bank and GazaWorldYemen, Rep.ZambiaZimbabwe Zeitlinie:
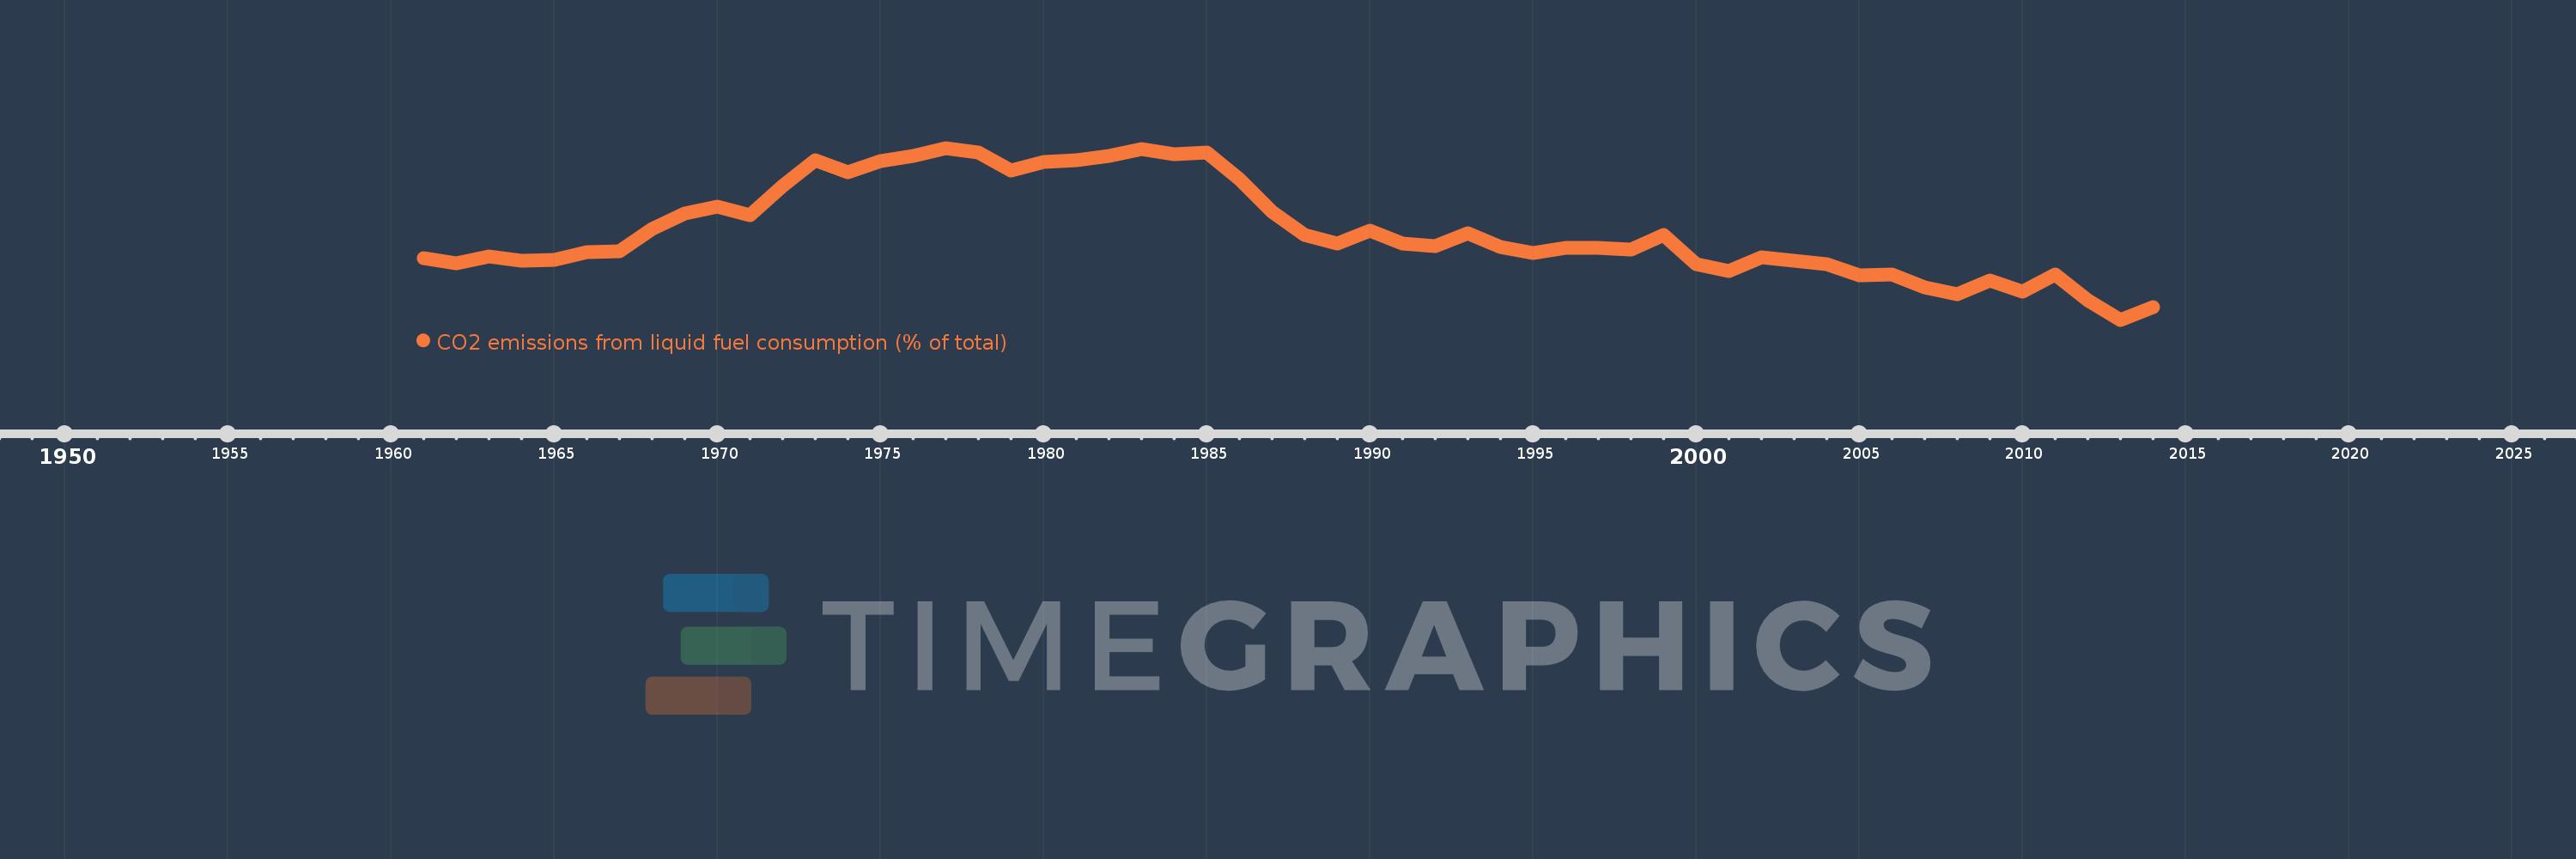
Diese Zeitleiste vorliegt die Graphik ab 1961 J. bis 2014 J. Portugal. Die Angaben bis 1960 J. sind nicht vorhanden. Die Zahl aktueller Beobachtungen nach Daten: 54.
Die Quelle (Bezeichnung):
Kennzahlen der Weltentwicklung
Die Quelle (Einrichtung):
Carbon Dioxide Information Analysis Center, Environmental Sciences Division, Oak Ridge National Laboratory, Tennessee, United States.
Kategorien:
Climate Change, Environment
Es wurde aktualisiert:
23 Apr 2017 Jahr
Kennzahlen der Wertänderungen vom Jahr zum Jahr
Minimum:
51.851
1 Jan 2013 Jahr
Maximum:
85.871
1 Jan 1977 Jahr
Zum Datum der Beobachtung
Wert
Absolute Veränderung
Die Veränderung bezüglich dem vorherigen Wert
1 Jan 1961 Jahr
63.977
+63.977
0.0%
1 Jan 1962 Jahr
63.009
-0.968
-1.51%
1 Jan 1963 Jahr
64.407
+1.398
2.22%
1 Jan 1964 Jahr
63.497
-0.91
-1.41%
1 Jan 1965 Jahr
63.739
+0.242
0.38%
1 Jan 1966 Jahr
65.255
+1.515
2.38%
1 Jan 1967 Jahr
65.377
+0.123
0.19%
1 Jan 1968 Jahr
69.77
+4.392
6.72%
1 Jan 1969 Jahr
72.971
+3.201
4.59%
1 Jan 1970 Jahr
74.329
+1.358
1.86%
1 Jan 1971 Jahr
72.627
-1.702
-2.29%
1 Jan 1972 Jahr
78.252
+5.625
7.75%
1 Jan 1973 Jahr
83.493
+5.241
6.7%
1 Jan 1974 Jahr
81.027
-2.467
-2.95%
1 Jan 1975 Jahr
83.201
+2.174
2.68%
1 Jan 1976 Jahr
84.272
+1.071
1.29%
1 Jan 1977 Jahr
85.871
+1.599
1.9%
1 Jan 1978 Jahr
85.044
-0.827
-0.96%
1 Jan 1979 Jahr
81.345
-3.699
-4.35%
1 Jan 1980 Jahr
83.035
+1.691
2.08%
1 Jan 1981 Jahr
83.354
+0.318
0.38%
1 Jan 1982 Jahr
84.323
+0.97
1.16%
1 Jan 1983 Jahr
85.698
+1.375
1.63%
1 Jan 1984 Jahr
84.654
-1.044
-1.22%
1 Jan 1985 Jahr
85.024
+0.37
0.44%
1 Jan 1986 Jahr
79.77
-5.254
-6.18%
1 Jan 1987 Jahr
73.183
-6.587
-8.26%
1 Jan 1988 Jahr
68.686
-4.497
-6.14%
1 Jan 1989 Jahr
67.012
-1.674
-2.44%
1 Jan 1990 Jahr
69.532
+2.52
3.76%
1 Jan 1991 Jahr
66.953
-2.579
-3.71%
1 Jan 1992 Jahr
66.4
-0.553
-0.83%
1 Jan 1993 Jahr
68.897
+2.497
3.76%
1 Jan 1994 Jahr
66.297
-2.6
-3.77%
1 Jan 1995 Jahr
65.077
-1.22
-1.84%
1 Jan 1996 Jahr
66.087
+1.01
1.55%
1 Jan 1997 Jahr
66.009
-0.078
-0.12%
1 Jan 1998 Jahr
65.771
-0.239
-0.36%
1 Jan 1999 Jahr
68.662
+2.892
4.4%
1 Jan 2000 Jahr
62.895
-5.768
-8.4%
1 Jan 2001 Jahr
61.454
-1.44
-2.29%
1 Jan 2002 Jahr
64.281
+2.826
4.6%
1 Jan 2003 Jahr
63.621
-0.659
-1.03%
1 Jan 2004 Jahr
62.819
-0.802
-1.26%
1 Jan 2005 Jahr
60.627
-2.192
-3.49%
1 Jan 2006 Jahr
60.825
+0.197
0.33%
1 Jan 2007 Jahr
58.319
-2.506
-4.12%
1 Jan 2008 Jahr
56.831
-1.488
-2.55%
1 Jan 2009 Jahr
59.556
+2.725
4.79%
1 Jan 2010 Jahr
57.432
-2.124
-3.57%
1 Jan 2011 Jahr
60.798
+3.366
5.86%
1 Jan 2012 Jahr
55.633
-5.166
-8.5%
1 Jan 2013 Jahr
51.851
-3.782
-6.8%
1 Jan 2014 Jahr
54.296
+2.445
4.72%
Bewertung der Länder gemäß mit laufender Statistik nach Jahren


Kommentare: