29
/de/
de
AIzaSyAYiBZKx7MnpbEhh9jyipgxe19OcubqV5w
April 1, 2024
150098
Honduras
HND
true
2
1
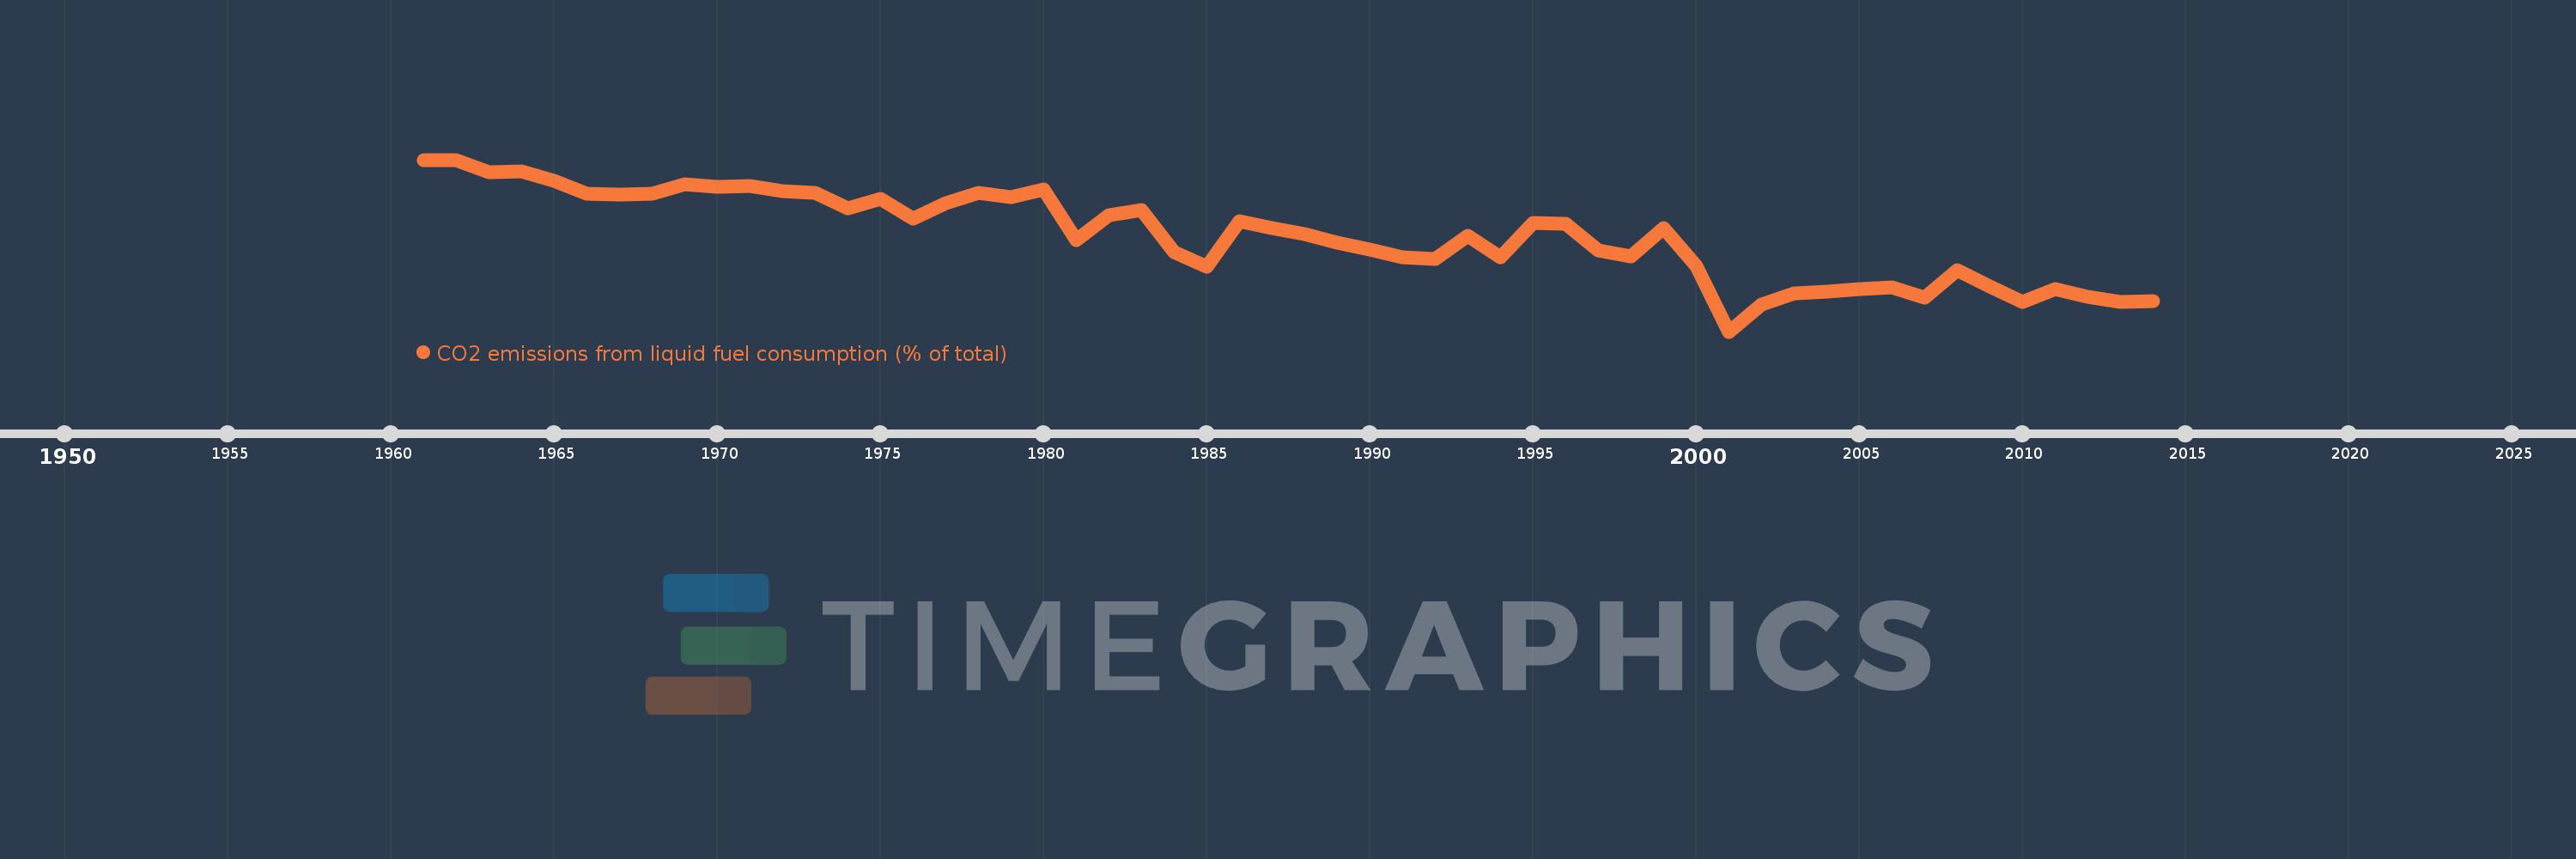
CO2 emissions from liquid fuel consumption (% of total)
2014,2013,2012,2011,2010,2009,2008,2007,2006,2005,2004,2003,2002,2001,2000,1999,1998,1997,1996,1995,1994,1993,1992,1991,1990,1989,1988,1987,1986,1985,1984,1983,1982,1981,1980,1979,1978,1977,1976,1975,1974,1973,1972,1971,1970,1969,1968,1967,1966,1965,1964,1963,1962,1961
Diese Statistik in anderen Ländern:
AfghanistanAlbaniaAlgeriaAndorraAngolaAntigua and BarbudaArab WorldArgentinaArmeniaArubaAustraliaAustriaAzerbaijanBahamas, TheBahrainBangladeshBarbadosBelarusBelgiumBelizeBeninBermudaBhutanBoliviaBosnia and HerzegovinaBotswanaBrazilBritish Virgin IslandsBrunei DarussalamBulgariaBurkina FasoBurundiCabo VerdeCambodiaCameroonCanadaCaribbean small statesCayman IslandsCentral African RepublicCentral Europe and the BalticsChadChileChinaColombiaComorosCongo, Dem. Rep.Congo, Rep.Costa RicaCote d'IvoireCroatiaCubaCuracaoCyprusCzech RepublicDenmarkDjiboutiDominicaDominican RepublicEarly-demographic dividendEast Asia & PacificEast Asia & Pacific (excluding high income)East Asia & Pacific (IDA & IBRD countries)EcuadorEgypt, Arab Rep.El SalvadorEquatorial GuineaEritreaEstoniaEthiopiaEuro areaEurope & Central AsiaEurope & Central Asia (excluding high income)Europe & Central Asia (IDA & IBRD countries)European UnionFaroe IslandsFijiFinlandFragile and conflict affected situationsFranceFrench PolynesiaGabonGambia, TheGeorgiaGermanyGhanaGibraltarGreeceGreenlandGrenadaGuatemalaGuineaGuinea-BissauGuyanaHaitiHeavily indebted poor countries (HIPC)High incomeHondurasHong Kong SAR, ChinaHungaryIBRD onlyIcelandIDA & IBRD totalIDA blendIDA onlyIDA totalIndiaIndonesiaIran, Islamic Rep.IraqIrelandIsraelItalyJamaicaJapanJordanKazakhstanKenyaKiribatiKorea, Dem. People’s Rep.Korea, Rep.KuwaitKyrgyz RepublicLao PDRLate-demographic dividendLatin America & Caribbean Latin America & Caribbean (excluding high income)Latin America & the Caribbean (IDA & IBRD countries)LatviaLeast developed countries: UN classificationLebanonLesothoLiberiaLibyaLiechtensteinLithuaniaLow & middle incomeLow incomeLower middle incomeLuxembourgMacao SAR, ChinaMacedonia, FYRMadagascarMalawiMalaysiaMaldivesMaliMaltaMarshall IslandsMauritaniaMauritiusMexicoMicronesia, Fed. Sts.Middle East & North AfricaMiddle East & North Africa (excluding high income)Middle East & North Africa (IDA & IBRD countries)Middle incomeMoldovaMongoliaMontenegroMoroccoMozambiqueMyanmarNamibiaNauruNepalNetherlandsNew CaledoniaNew ZealandNicaraguaNigerNigeriaNorth AmericaNorwayOECD membersOmanOther small statesPacific island small statesPakistanPalauPanamaPapua New GuineaParaguayPeruPhilippinesPolandPortugalPost-demographic dividendPre-demographic dividendQatarRomaniaRussian FederationRwandaSamoaSao Tome and PrincipeSaudi ArabiaSenegalSerbiaSeychellesSierra LeoneSingaporeSint Maarten (Dutch part)Slovak RepublicSloveniaSmall statesSolomon IslandsSomaliaSouth AfricaSouth AsiaSouth Asia (IDA & IBRD)South SudanSpainSri LankaSt. Kitts and NevisSt. LuciaSt. Vincent and the GrenadinesSub-Saharan Africa Sub-Saharan Africa (excluding high income)Sub-Saharan Africa (IDA & IBRD countries)SudanSurinameSwazilandSwedenSwitzerlandSyrian Arab RepublicTajikistanTanzaniaThailandTimor-LesteTogoTongaTrinidad and TobagoTunisiaTurkeyTurkmenistanTurks and Caicos IslandsUgandaUkraineUnited Arab EmiratesUnited KingdomUnited StatesUpper middle incomeUruguayUzbekistanVanuatuVenezuela, RBVietnamWest Bank and GazaWorldYemen, Rep.ZambiaZimbabwe Zeitlinie:
Diese Zeitleiste vorliegt die Graphik ab 1961 J. bis 2014 J. Honduras. Die Angaben bis 1960 J. sind nicht vorhanden. Die Zahl aktueller Beobachtungen nach Daten: 54.
Die Quelle (Bezeichnung):
Kennzahlen der Weltentwicklung
Die Quelle (Einrichtung):
Carbon Dioxide Information Analysis Center, Environmental Sciences Division, Oak Ridge National Laboratory, Tennessee, United States.
Kategorien:
Climate Change, Environment
Es wurde aktualisiert:
23 Apr 2017 Jahr
Kennzahlen der Wertänderungen vom Jahr zum Jahr
Minimum:
80.102
1 Jan 2001 Jahr
Maximum:
97.024
1 Jan 1961 Jahr
Zum Datum der Beobachtung
Wert
Absolute Veränderung
Die Veränderung bezüglich dem vorherigen Wert
1 Jan 1961 Jahr
97.024
+97.024
0.0%
1 Jan 1962 Jahr
97.015
-0.009
-0.01%
1 Jan 1963 Jahr
95.812
-1.203
-1.24%
1 Jan 1964 Jahr
95.876
+0.065
0.07%
1 Jan 1965 Jahr
94.924
-0.952
-0.99%
1 Jan 1966 Jahr
93.659
-1.265
-1.33%
1 Jan 1967 Jahr
93.636
-0.022
-0.02%
1 Jan 1968 Jahr
93.724
+0.087
0.09%
1 Jan 1969 Jahr
94.611
+0.887
0.95%
1 Jan 1970 Jahr
94.393
-0.218
-0.23%
1 Jan 1971 Jahr
94.459
+0.067
0.07%
1 Jan 1972 Jahr
93.939
-0.52
-0.55%
1 Jan 1973 Jahr
93.795
-0.145
-0.15%
1 Jan 1974 Jahr
92.233
-1.562
-1.67%
1 Jan 1975 Jahr
93.176
+0.943
1.02%
1 Jan 1976 Jahr
91.209
-1.968
-2.11%
1 Jan 1977 Jahr
92.784
+1.575
1.73%
1 Jan 1978 Jahr
93.773
+0.989
1.07%
1 Jan 1979 Jahr
93.381
-0.392
-0.42%
1 Jan 1980 Jahr
94.118
+0.737
0.79%
1 Jan 1981 Jahr
89.127
-4.991
-5.3%
1 Jan 1982 Jahr
91.549
+2.423
2.72%
1 Jan 1983 Jahr
92.1
+0.55
0.6%
1 Jan 1984 Jahr
87.912
-4.188
-4.55%
1 Jan 1985 Jahr
86.531
-1.381
-1.57%
1 Jan 1986 Jahr
90.962
+4.43
5.12%
1 Jan 1987 Jahr
90.278
-0.684
-0.75%
1 Jan 1988 Jahr
89.713
-0.564
-0.63%
1 Jan 1989 Jahr
88.873
-0.841
-0.94%
1 Jan 1990 Jahr
88.172
-0.701
-0.79%
1 Jan 1991 Jahr
87.412
-0.76
-0.86%
1 Jan 1992 Jahr
87.228
-0.183
-0.21%
1 Jan 1993 Jahr
89.511
+2.283
2.62%
1 Jan 1994 Jahr
87.387
-2.124
-2.37%
1 Jan 1995 Jahr
90.769
+3.382
3.87%
1 Jan 1996 Jahr
90.737
-0.032
-0.04%
1 Jan 1997 Jahr
88.056
-2.682
-2.96%
1 Jan 1998 Jahr
87.478
-0.578
-0.66%
1 Jan 1999 Jahr
90.3
+2.822
3.23%
1 Jan 2000 Jahr
86.543
-3.757
-4.16%
1 Jan 2001 Jahr
80.102
-6.441
-7.44%
1 Jan 2002 Jahr
82.734
+2.632
3.29%
1 Jan 2003 Jahr
83.865
+1.131
1.37%
1 Jan 2004 Jahr
84.02
+0.154
0.18%
1 Jan 2005 Jahr
84.321
+0.301
0.36%
1 Jan 2006 Jahr
84.466
+0.145
0.17%
1 Jan 2007 Jahr
83.412
-1.054
-1.25%
1 Jan 2008 Jahr
86.174
+2.762
3.31%
1 Jan 2009 Jahr
84.567
-1.607
-1.87%
1 Jan 2010 Jahr
83.046
-1.52
-1.8%
1 Jan 2011 Jahr
84.276
+1.23
1.48%
1 Jan 2012 Jahr
83.538
-0.738
-0.88%
1 Jan 2013 Jahr
82.98
-0.558
-0.67%
1 Jan 2014 Jahr
83.131
+0.151
0.18%
Bewertung der Länder gemäß mit laufender Statistik nach Jahren


Kommentare: