29
/de/
de
AIzaSyAYiBZKx7MnpbEhh9jyipgxe19OcubqV5w
April 1, 2024
132954
Finland
FIN
true
2
1
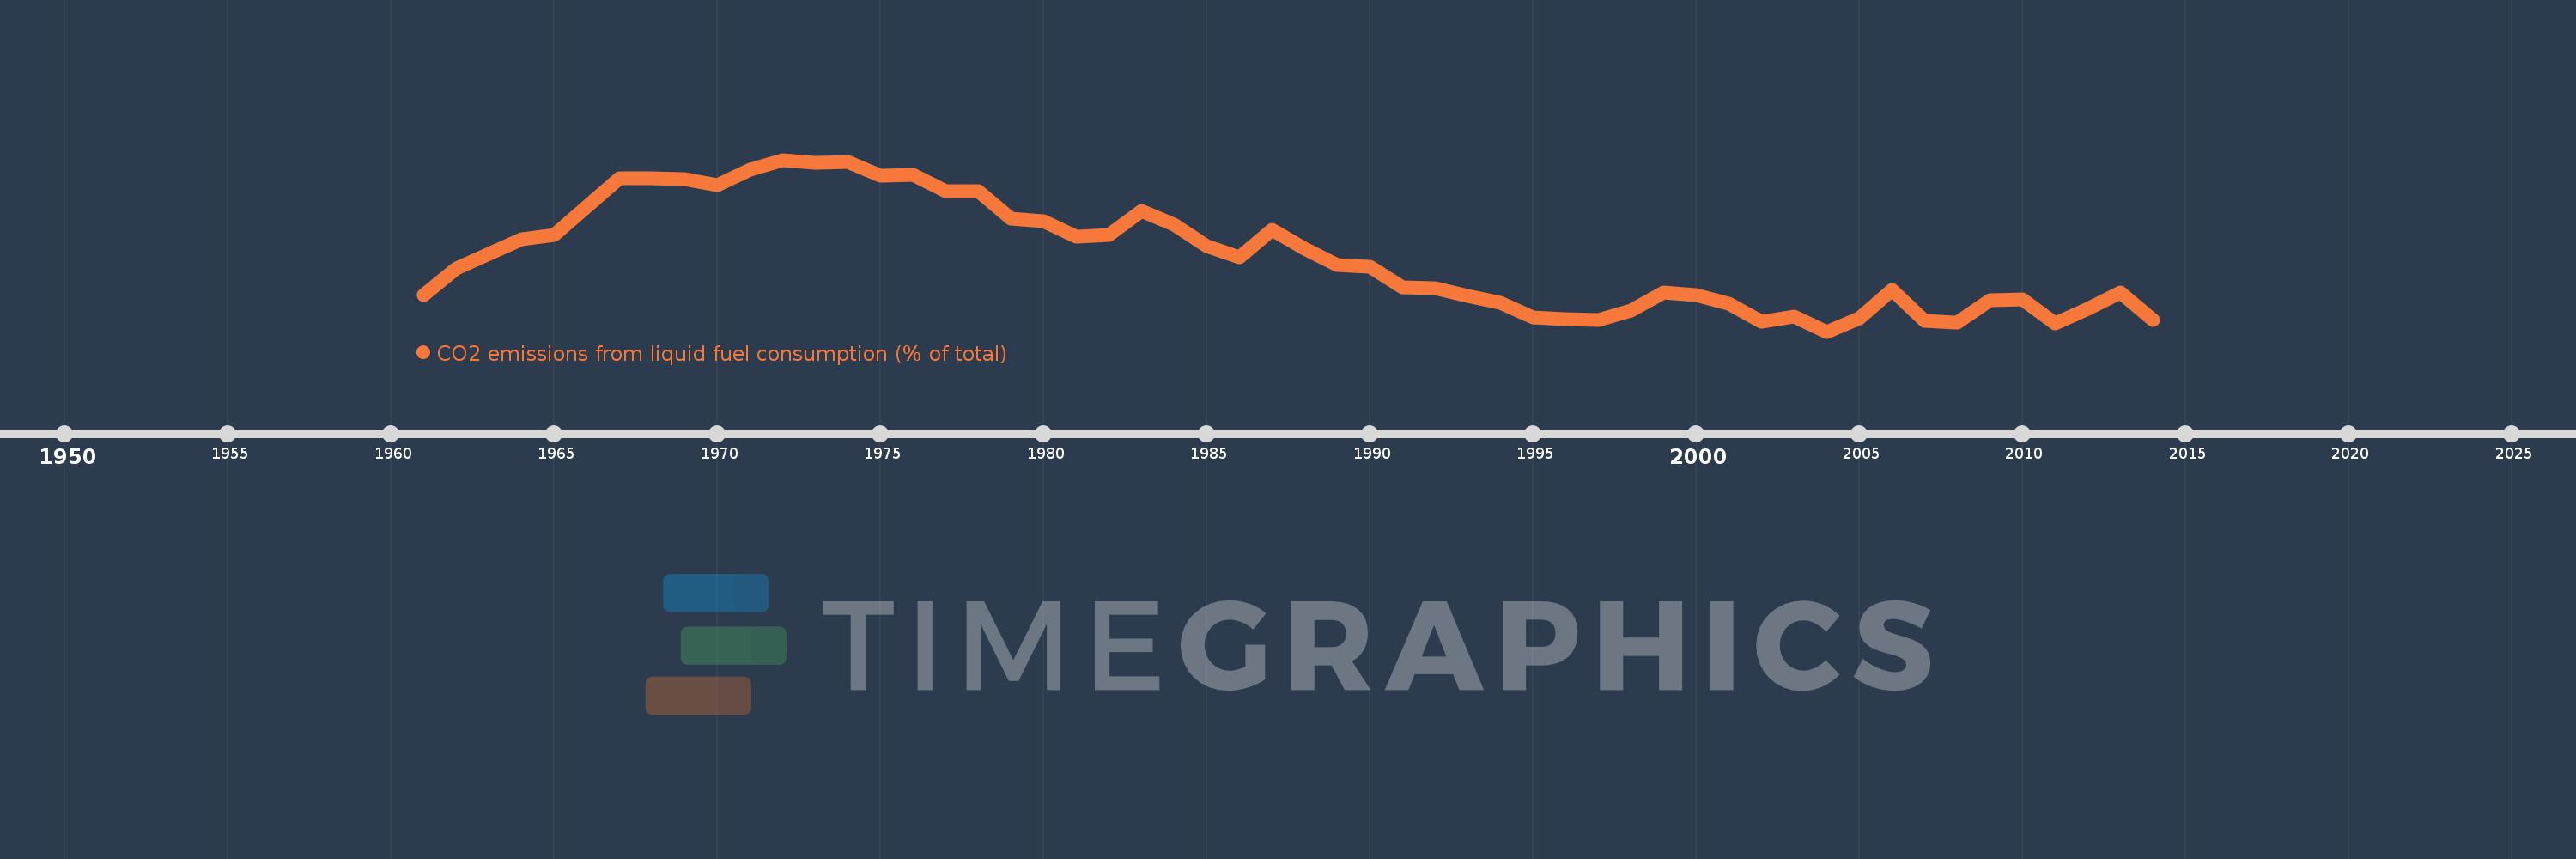
CO2 emissions from liquid fuel consumption (% of total)
2014,2013,2012,2011,2010,2009,2008,2007,2006,2005,2004,2003,2002,2001,2000,1999,1998,1997,1996,1995,1994,1993,1992,1991,1990,1989,1988,1987,1986,1985,1984,1983,1982,1981,1980,1979,1978,1977,1976,1975,1974,1973,1972,1971,1970,1969,1968,1967,1966,1965,1964,1963,1962,1961
Diese Statistik in anderen Ländern:
AfghanistanAlbaniaAlgeriaAndorraAngolaAntigua and BarbudaArab WorldArgentinaArmeniaArubaAustraliaAustriaAzerbaijanBahamas, TheBahrainBangladeshBarbadosBelarusBelgiumBelizeBeninBermudaBhutanBoliviaBosnia and HerzegovinaBotswanaBrazilBritish Virgin IslandsBrunei DarussalamBulgariaBurkina FasoBurundiCabo VerdeCambodiaCameroonCanadaCaribbean small statesCayman IslandsCentral African RepublicCentral Europe and the BalticsChadChileChinaColombiaComorosCongo, Dem. Rep.Congo, Rep.Costa RicaCote d'IvoireCroatiaCubaCuracaoCyprusCzech RepublicDenmarkDjiboutiDominicaDominican RepublicEarly-demographic dividendEast Asia & PacificEast Asia & Pacific (excluding high income)East Asia & Pacific (IDA & IBRD countries)EcuadorEgypt, Arab Rep.El SalvadorEquatorial GuineaEritreaEstoniaEthiopiaEuro areaEurope & Central AsiaEurope & Central Asia (excluding high income)Europe & Central Asia (IDA & IBRD countries)European UnionFaroe IslandsFijiFinlandFragile and conflict affected situationsFranceFrench PolynesiaGabonGambia, TheGeorgiaGermanyGhanaGibraltarGreeceGreenlandGrenadaGuatemalaGuineaGuinea-BissauGuyanaHaitiHeavily indebted poor countries (HIPC)High incomeHondurasHong Kong SAR, ChinaHungaryIBRD onlyIcelandIDA & IBRD totalIDA blendIDA onlyIDA totalIndiaIndonesiaIran, Islamic Rep.IraqIrelandIsraelItalyJamaicaJapanJordanKazakhstanKenyaKiribatiKorea, Dem. People’s Rep.Korea, Rep.KuwaitKyrgyz RepublicLao PDRLate-demographic dividendLatin America & Caribbean Latin America & Caribbean (excluding high income)Latin America & the Caribbean (IDA & IBRD countries)LatviaLeast developed countries: UN classificationLebanonLesothoLiberiaLibyaLiechtensteinLithuaniaLow & middle incomeLow incomeLower middle incomeLuxembourgMacao SAR, ChinaMacedonia, FYRMadagascarMalawiMalaysiaMaldivesMaliMaltaMarshall IslandsMauritaniaMauritiusMexicoMicronesia, Fed. Sts.Middle East & North AfricaMiddle East & North Africa (excluding high income)Middle East & North Africa (IDA & IBRD countries)Middle incomeMoldovaMongoliaMontenegroMoroccoMozambiqueMyanmarNamibiaNauruNepalNetherlandsNew CaledoniaNew ZealandNicaraguaNigerNigeriaNorth AmericaNorwayOECD membersOmanOther small statesPacific island small statesPakistanPalauPanamaPapua New GuineaParaguayPeruPhilippinesPolandPortugalPost-demographic dividendPre-demographic dividendQatarRomaniaRussian FederationRwandaSamoaSao Tome and PrincipeSaudi ArabiaSenegalSerbiaSeychellesSierra LeoneSingaporeSint Maarten (Dutch part)Slovak RepublicSloveniaSmall statesSolomon IslandsSomaliaSouth AfricaSouth AsiaSouth Asia (IDA & IBRD)South SudanSpainSri LankaSt. Kitts and NevisSt. LuciaSt. Vincent and the GrenadinesSub-Saharan Africa Sub-Saharan Africa (excluding high income)Sub-Saharan Africa (IDA & IBRD countries)SudanSurinameSwazilandSwedenSwitzerlandSyrian Arab RepublicTajikistanTanzaniaThailandTimor-LesteTogoTongaTrinidad and TobagoTunisiaTurkeyTurkmenistanTurks and Caicos IslandsUgandaUkraineUnited Arab EmiratesUnited KingdomUnited StatesUpper middle incomeUruguayUzbekistanVanuatuVenezuela, RBVietnamWest Bank and GazaWorldYemen, Rep.ZambiaZimbabwe Zeitlinie:
Diese Zeitleiste vorliegt die Graphik ab 1961 J. bis 2014 J. Finland. Die Angaben bis 1960 J. sind nicht vorhanden. Die Zahl aktueller Beobachtungen nach Daten: 54.
Die Quelle (Bezeichnung):
Kennzahlen der Weltentwicklung
Die Quelle (Einrichtung):
Carbon Dioxide Information Analysis Center, Environmental Sciences Division, Oak Ridge National Laboratory, Tennessee, United States.
Kategorien:
Climate Change, Environment
Es wurde aktualisiert:
23 Apr 2017 Jahr
Kennzahlen der Wertänderungen vom Jahr zum Jahr
Minimum:
39.439
1 Jan 2004 Jahr
Maximum:
78.558
1 Jan 1972 Jahr
Zum Datum der Beobachtung
Wert
Absolute Veränderung
Die Veränderung bezüglich dem vorherigen Wert
1 Jan 1961 Jahr
47.73
+47.73
0.0%
1 Jan 1962 Jahr
53.731
+6.001
12.57%
1 Jan 1963 Jahr
57.177
+3.446
6.41%
1 Jan 1964 Jahr
60.542
+3.365
5.88%
1 Jan 1965 Jahr
61.473
+0.931
1.54%
1 Jan 1966 Jahr
67.96
+6.487
10.55%
1 Jan 1967 Jahr
74.323
+6.363
9.36%
1 Jan 1968 Jahr
74.295
-0.028
-0.04%
1 Jan 1969 Jahr
74.155
-0.14
-0.19%
1 Jan 1970 Jahr
72.721
-1.434
-1.93%
1 Jan 1971 Jahr
76.289
+3.568
4.91%
1 Jan 1972 Jahr
78.558
+2.269
2.97%
1 Jan 1973 Jahr
77.788
-0.77
-0.98%
1 Jan 1974 Jahr
78.052
+0.264
0.34%
1 Jan 1975 Jahr
74.902
-3.15
-4.04%
1 Jan 1976 Jahr
75.151
+0.249
0.33%
1 Jan 1977 Jahr
71.389
-3.762
-5.01%
1 Jan 1978 Jahr
71.435
+0.046
0.06%
1 Jan 1979 Jahr
65.099
-6.336
-8.87%
1 Jan 1980 Jahr
64.608
-0.49
-0.75%
1 Jan 1981 Jahr
61.03
-3.578
-5.54%
1 Jan 1982 Jahr
61.486
+0.456
0.75%
1 Jan 1983 Jahr
66.831
+5.345
8.69%
1 Jan 1984 Jahr
63.75
-3.081
-4.61%
1 Jan 1985 Jahr
58.978
-4.773
-7.49%
1 Jan 1986 Jahr
56.276
-2.702
-4.58%
1 Jan 1987 Jahr
62.532
+6.256
11.12%
1 Jan 1988 Jahr
58.278
-4.254
-6.8%
1 Jan 1989 Jahr
54.564
-3.714
-6.37%
1 Jan 1990 Jahr
54.212
-0.352
-0.65%
1 Jan 1991 Jahr
49.6
-4.612
-8.51%
1 Jan 1992 Jahr
49.385
-0.214
-0.43%
1 Jan 1993 Jahr
47.459
-1.927
-3.9%
1 Jan 1994 Jahr
46.017
-1.442
-3.04%
1 Jan 1995 Jahr
42.756
-3.261
-7.09%
1 Jan 1996 Jahr
42.351
-0.404
-0.95%
1 Jan 1997 Jahr
42.066
-0.286
-0.67%
1 Jan 1998 Jahr
44.261
+2.195
5.22%
1 Jan 1999 Jahr
48.272
+4.011
9.06%
1 Jan 2000 Jahr
47.764
-0.509
-1.05%
1 Jan 2001 Jahr
45.786
-1.978
-4.14%
1 Jan 2002 Jahr
41.715
-4.071
-8.89%
1 Jan 2003 Jahr
42.917
+1.202
2.88%
1 Jan 2004 Jahr
39.439
-3.478
-8.1%
1 Jan 2005 Jahr
42.474
+3.035
7.7%
1 Jan 2006 Jahr
48.946
+6.473
15.24%
1 Jan 2007 Jahr
41.932
-7.014
-14.33%
1 Jan 2008 Jahr
41.469
-0.463
-1.1%
1 Jan 2009 Jahr
46.539
+5.069
12.22%
1 Jan 2010 Jahr
46.75
+0.212
0.45%
1 Jan 2011 Jahr
41.343
-5.407
-11.57%
1 Jan 2012 Jahr
44.552
+3.208
7.76%
1 Jan 2013 Jahr
48.336
+3.785
8.5%
1 Jan 2014 Jahr
42.048
-6.288
-13.01%
Bewertung der Länder gemäß mit laufender Statistik nach Jahren


Kommentare: