29
/de/
de
AIzaSyAYiBZKx7MnpbEhh9jyipgxe19OcubqV5w
April 1, 2024
140114
Ghana
GHA
true
2
1
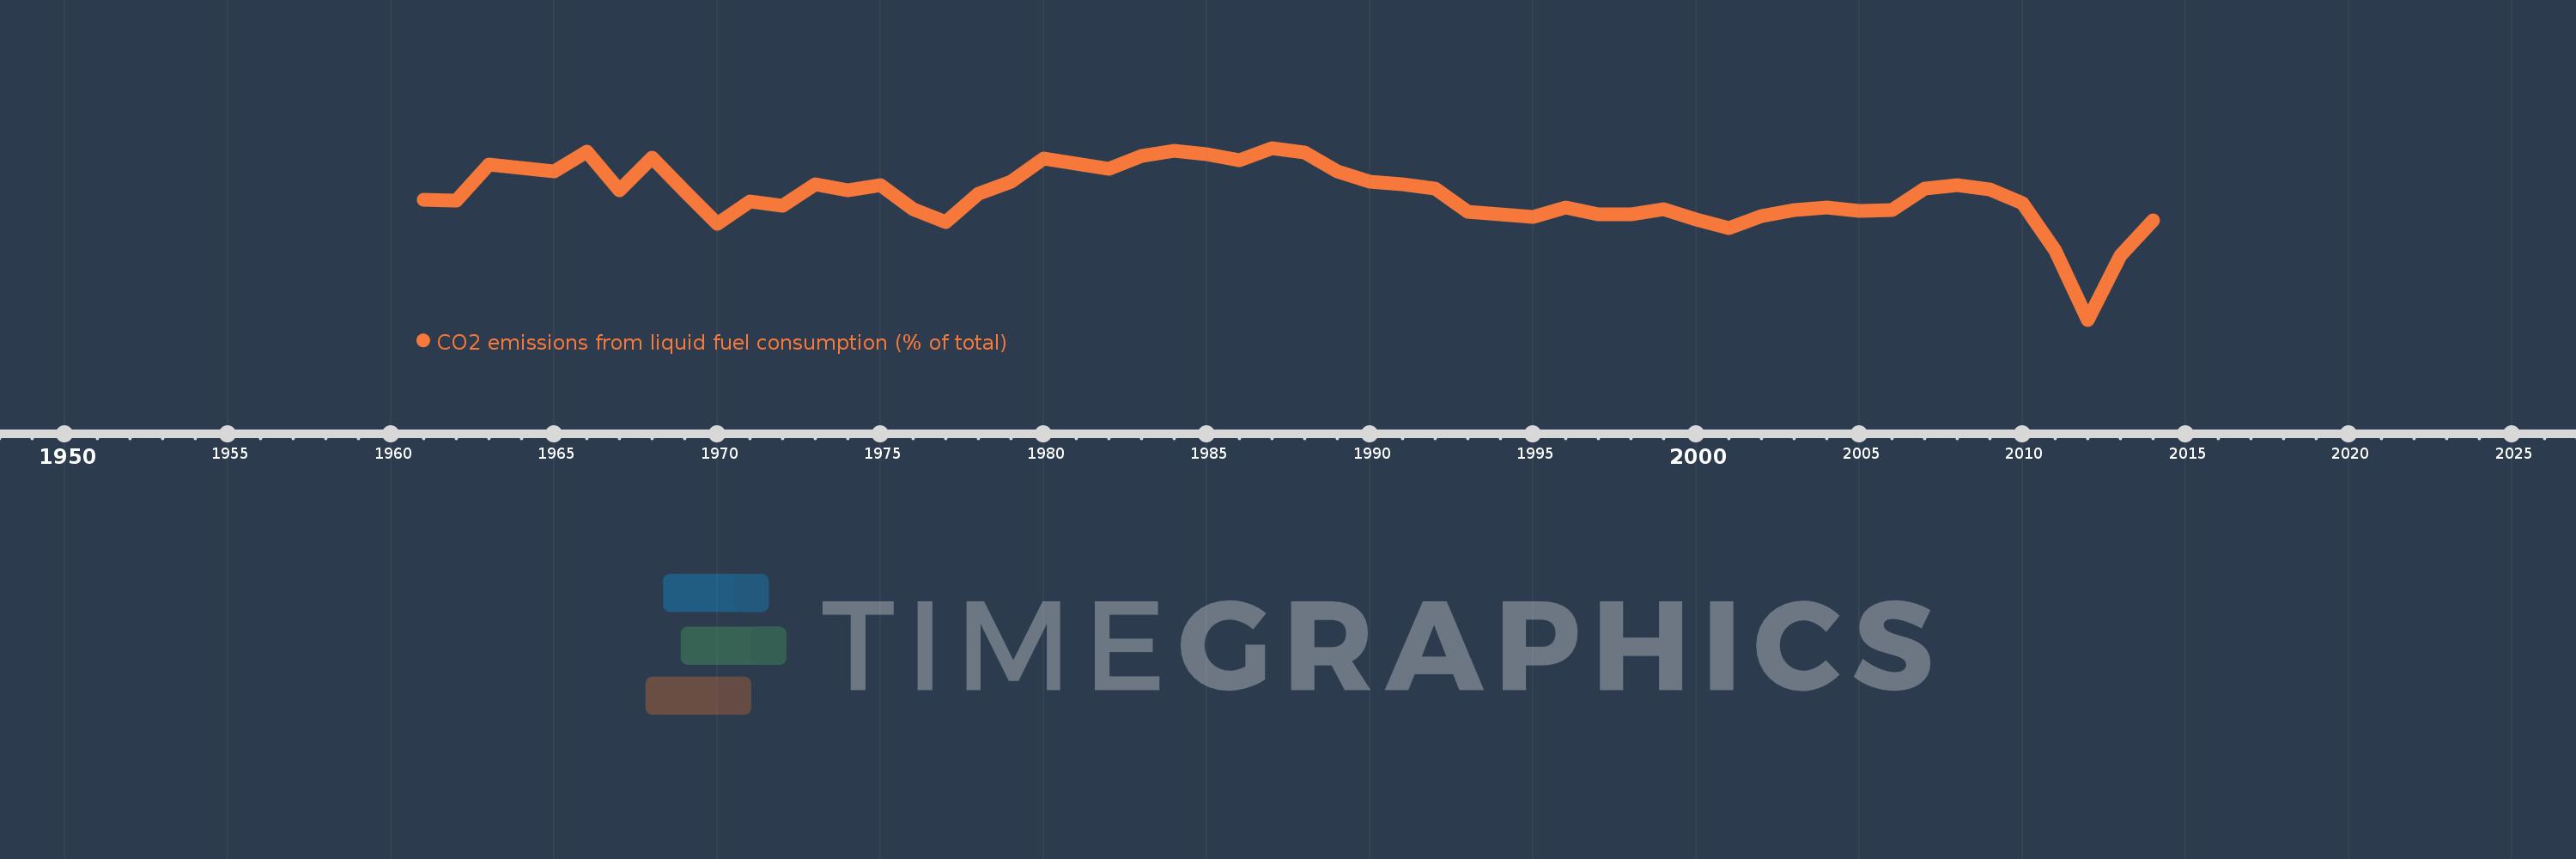
CO2 emissions from liquid fuel consumption (% of total)
2014,2013,2012,2011,2010,2009,2008,2007,2006,2005,2004,2003,2002,2001,2000,1999,1998,1997,1996,1995,1994,1993,1992,1991,1990,1989,1988,1987,1986,1985,1984,1983,1982,1981,1980,1979,1978,1977,1976,1975,1974,1973,1972,1971,1970,1969,1968,1967,1966,1965,1964,1963,1962,1961
Diese Statistik in anderen Ländern:
AfghanistanAlbaniaAlgeriaAndorraAngolaAntigua and BarbudaArab WorldArgentinaArmeniaArubaAustraliaAustriaAzerbaijanBahamas, TheBahrainBangladeshBarbadosBelarusBelgiumBelizeBeninBermudaBhutanBoliviaBosnia and HerzegovinaBotswanaBrazilBritish Virgin IslandsBrunei DarussalamBulgariaBurkina FasoBurundiCabo VerdeCambodiaCameroonCanadaCaribbean small statesCayman IslandsCentral African RepublicCentral Europe and the BalticsChadChileChinaColombiaComorosCongo, Dem. Rep.Congo, Rep.Costa RicaCote d'IvoireCroatiaCubaCuracaoCyprusCzech RepublicDenmarkDjiboutiDominicaDominican RepublicEarly-demographic dividendEast Asia & PacificEast Asia & Pacific (excluding high income)East Asia & Pacific (IDA & IBRD countries)EcuadorEgypt, Arab Rep.El SalvadorEquatorial GuineaEritreaEstoniaEthiopiaEuro areaEurope & Central AsiaEurope & Central Asia (excluding high income)Europe & Central Asia (IDA & IBRD countries)European UnionFaroe IslandsFijiFinlandFragile and conflict affected situationsFranceFrench PolynesiaGabonGambia, TheGeorgiaGermanyGhanaGibraltarGreeceGreenlandGrenadaGuatemalaGuineaGuinea-BissauGuyanaHaitiHeavily indebted poor countries (HIPC)High incomeHondurasHong Kong SAR, ChinaHungaryIBRD onlyIcelandIDA & IBRD totalIDA blendIDA onlyIDA totalIndiaIndonesiaIran, Islamic Rep.IraqIrelandIsraelItalyJamaicaJapanJordanKazakhstanKenyaKiribatiKorea, Dem. People’s Rep.Korea, Rep.KuwaitKyrgyz RepublicLao PDRLate-demographic dividendLatin America & Caribbean Latin America & Caribbean (excluding high income)Latin America & the Caribbean (IDA & IBRD countries)LatviaLeast developed countries: UN classificationLebanonLesothoLiberiaLibyaLiechtensteinLithuaniaLow & middle incomeLow incomeLower middle incomeLuxembourgMacao SAR, ChinaMacedonia, FYRMadagascarMalawiMalaysiaMaldivesMaliMaltaMarshall IslandsMauritaniaMauritiusMexicoMicronesia, Fed. Sts.Middle East & North AfricaMiddle East & North Africa (excluding high income)Middle East & North Africa (IDA & IBRD countries)Middle incomeMoldovaMongoliaMontenegroMoroccoMozambiqueMyanmarNamibiaNauruNepalNetherlandsNew CaledoniaNew ZealandNicaraguaNigerNigeriaNorth AmericaNorwayOECD membersOmanOther small statesPacific island small statesPakistanPalauPanamaPapua New GuineaParaguayPeruPhilippinesPolandPortugalPost-demographic dividendPre-demographic dividendQatarRomaniaRussian FederationRwandaSamoaSao Tome and PrincipeSaudi ArabiaSenegalSerbiaSeychellesSierra LeoneSingaporeSint Maarten (Dutch part)Slovak RepublicSloveniaSmall statesSolomon IslandsSomaliaSouth AfricaSouth AsiaSouth Asia (IDA & IBRD)South SudanSpainSri LankaSt. Kitts and NevisSt. LuciaSt. Vincent and the GrenadinesSub-Saharan Africa Sub-Saharan Africa (excluding high income)Sub-Saharan Africa (IDA & IBRD countries)SudanSurinameSwazilandSwedenSwitzerlandSyrian Arab RepublicTajikistanTanzaniaThailandTimor-LesteTogoTongaTrinidad and TobagoTunisiaTurkeyTurkmenistanTurks and Caicos IslandsUgandaUkraineUnited Arab EmiratesUnited KingdomUnited StatesUpper middle incomeUruguayUzbekistanVanuatuVenezuela, RBVietnamWest Bank and GazaWorldYemen, Rep.ZambiaZimbabwe Zeitlinie:
Diese Zeitleiste vorliegt die Graphik ab 1961 J. bis 2014 J. Ghana. Die Angaben bis 1960 J. sind nicht vorhanden. Die Zahl aktueller Beobachtungen nach Daten: 54.
Die Quelle (Bezeichnung):
Kennzahlen der Weltentwicklung
Die Quelle (Einrichtung):
Carbon Dioxide Information Analysis Center, Environmental Sciences Division, Oak Ridge National Laboratory, Tennessee, United States.
Kategorien:
Climate Change, Environment
Es wurde aktualisiert:
23 Apr 2017 Jahr
Kennzahlen der Wertänderungen vom Jahr zum Jahr
Minimum:
71.205
1 Jan 2012 Jahr
Maximum:
96.27
1 Jan 1987 Jahr
Zum Datum der Beobachtung
Wert
Absolute Veränderung
Die Veränderung bezüglich dem vorherigen Wert
1 Jan 1961 Jahr
88.722
+88.722
0.0%
1 Jan 1962 Jahr
88.556
-0.166
-0.19%
1 Jan 1963 Jahr
93.862
+5.306
5.99%
1 Jan 1964 Jahr
93.404
-0.458
-0.49%
1 Jan 1965 Jahr
92.889
-0.515
-0.55%
1 Jan 1966 Jahr
95.699
+2.81
3.03%
1 Jan 1967 Jahr
90.076
-5.623
-5.88%
1 Jan 1968 Jahr
94.853
+4.777
5.3%
1 Jan 1969 Jahr
90.021
-4.832
-5.09%
1 Jan 1970 Jahr
85.249
-4.771
-5.3%
1 Jan 1971 Jahr
88.408
+3.158
3.7%
1 Jan 1972 Jahr
87.859
-0.548
-0.62%
1 Jan 1973 Jahr
90.923
+3.063
3.49%
1 Jan 1974 Jahr
90.074
-0.849
-0.93%
1 Jan 1975 Jahr
90.886
+0.812
0.9%
1 Jan 1976 Jahr
87.316
-3.57
-3.93%
1 Jan 1977 Jahr
85.392
-1.925
-2.2%
1 Jan 1978 Jahr
89.621
+4.23
4.95%
1 Jan 1979 Jahr
91.358
+1.737
1.94%
1 Jan 1980 Jahr
94.759
+3.401
3.72%
1 Jan 1981 Jahr
93.983
-0.776
-0.82%
1 Jan 1982 Jahr
93.261
-0.722
-0.77%
1 Jan 1983 Jahr
95.06
+1.799
1.93%
1 Jan 1984 Jahr
95.888
+0.827
0.87%
1 Jan 1985 Jahr
95.313
-0.575
-0.6%
1 Jan 1986 Jahr
94.487
-0.825
-0.87%
1 Jan 1987 Jahr
96.27
+1.782
1.89%
1 Jan 1988 Jahr
95.647
-0.622
-0.65%
1 Jan 1989 Jahr
92.88
-2.767
-2.89%
1 Jan 1990 Jahr
91.338
-1.542
-1.66%
1 Jan 1991 Jahr
90.97
-0.367
-0.4%
1 Jan 1992 Jahr
90.308
-0.663
-0.73%
1 Jan 1993 Jahr
86.924
-3.383
-3.75%
1 Jan 1994 Jahr
86.532
-0.392
-0.45%
1 Jan 1995 Jahr
86.232
-0.3
-0.35%
1 Jan 1996 Jahr
87.561
+1.328
1.54%
1 Jan 1997 Jahr
86.536
-1.025
-1.17%
1 Jan 1998 Jahr
86.578
+0.042
0.05%
1 Jan 1999 Jahr
87.285
+0.707
0.82%
1 Jan 2000 Jahr
85.778
-1.507
-1.73%
1 Jan 2001 Jahr
84.548
-1.23
-1.43%
1 Jan 2002 Jahr
86.328
+1.779
2.1%
1 Jan 2003 Jahr
87.253
+0.925
1.07%
1 Jan 2004 Jahr
87.602
+0.349
0.4%
1 Jan 2005 Jahr
87.126
-0.476
-0.54%
1 Jan 2006 Jahr
87.153
+0.027
0.03%
1 Jan 2007 Jahr
90.4
+3.247
3.73%
1 Jan 2008 Jahr
90.858
+0.459
0.51%
1 Jan 2009 Jahr
90.169
-0.69
-0.76%
1 Jan 2010 Jahr
88.249
-1.919
-2.13%
1 Jan 2011 Jahr
81.326
-6.923
-7.85%
1 Jan 2012 Jahr
71.205
-10.121
-12.45%
1 Jan 2013 Jahr
80.611
+9.407
13.21%
1 Jan 2014 Jahr
85.653
+5.042
6.25%
Bewertung der Länder gemäß mit laufender Statistik nach Jahren


Kommentare: