Download This statistics in other country:
Timeline:
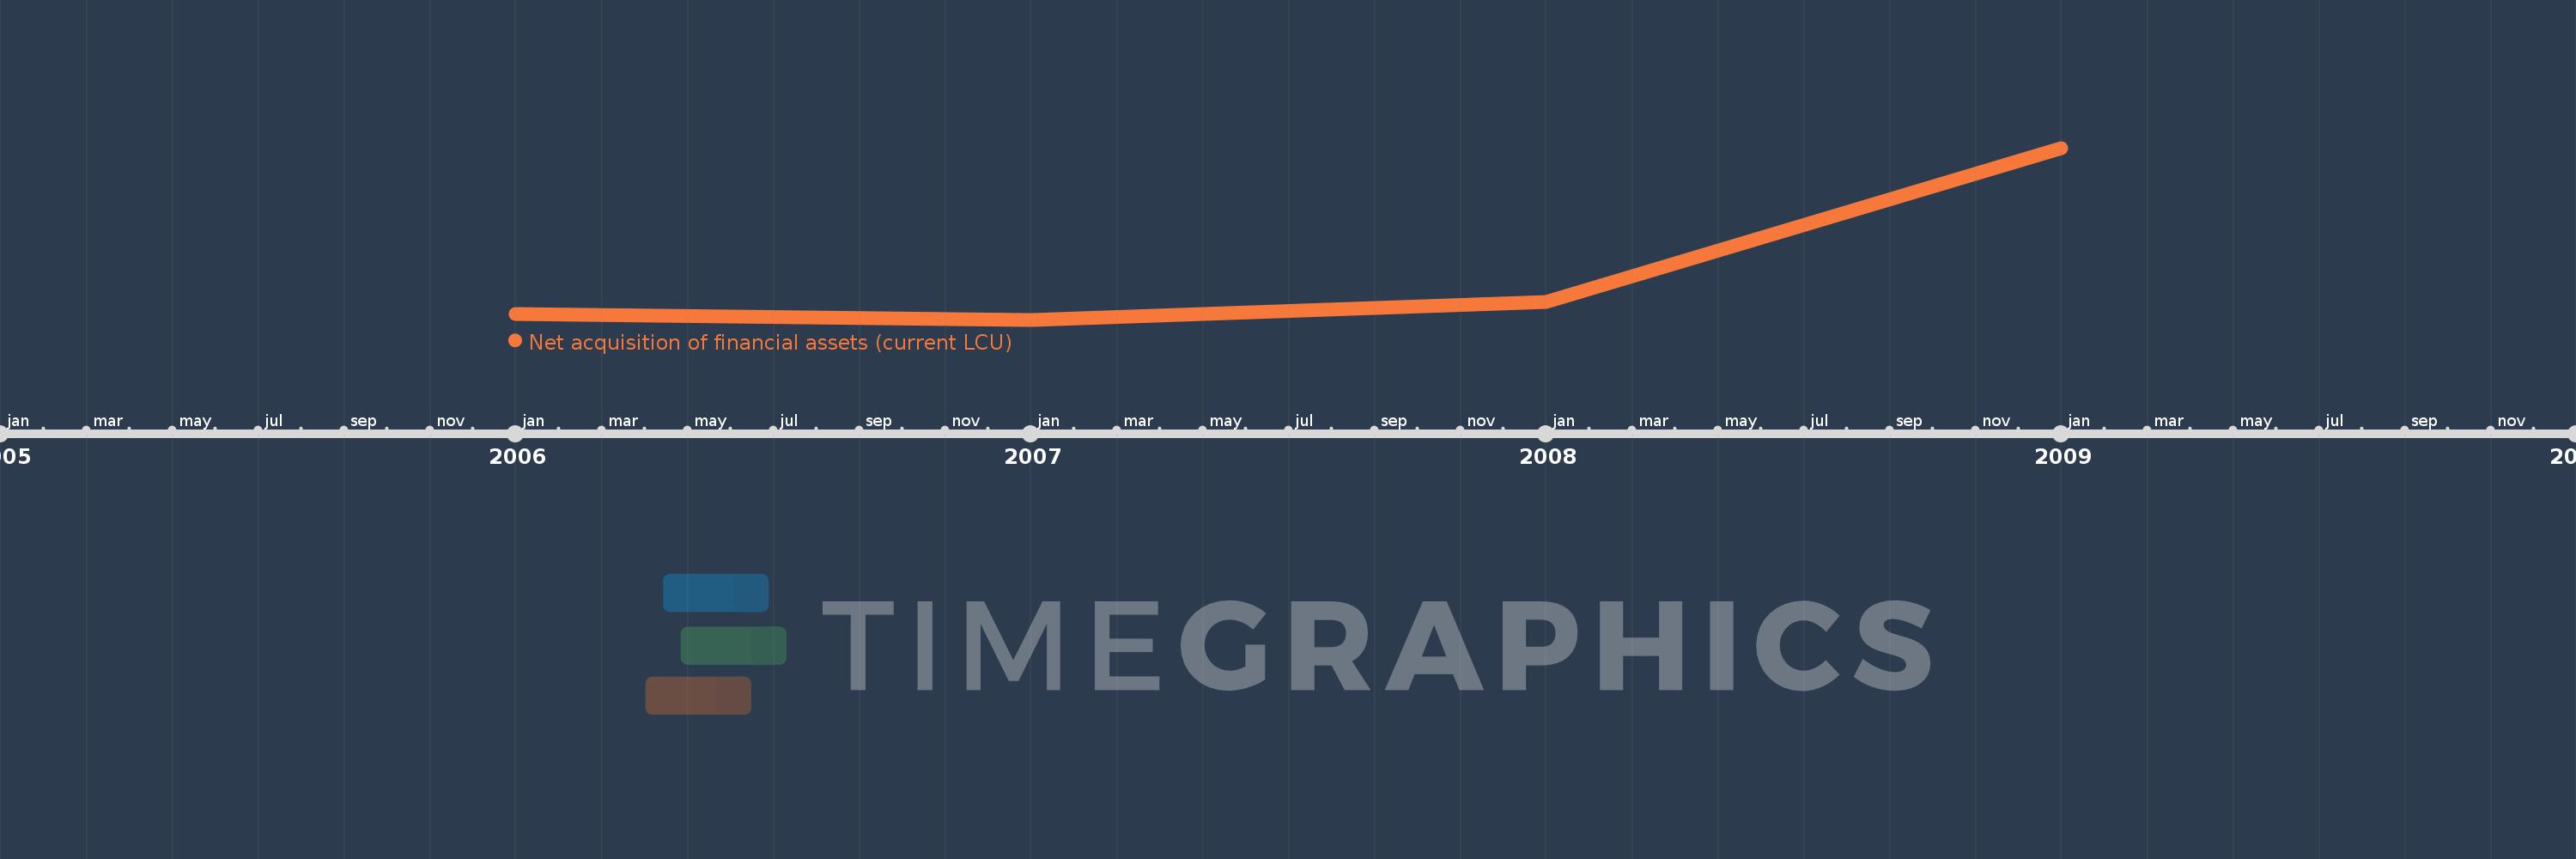
This timeline shows a graph from 2006 to 2009 of Cabo Verde. No data until 2005. Number of actual observations by date: 4.
Source name:
World Development Indicators
Source organization:
International Monetary Fund, Government Finance Statistics Yearbook and data files.
Categories, topics:
Public Sector
Last updated:
apr 23, 2017
Indicators value changes by year
Minimum:
1.667 bln
jan 1, 2007
Maximum:
7.19 bln
jan 1, 2009
At the date of observation
Value
Absolute change
Change from the previous value
jan 1, 2006
1.863 bln
+1.863 bln
0.0%
jan 1, 2007
1.667 bln
-195.751 mln
-10.51%
jan 1, 2008
2.231 bln
+563.818 mln
33.82%
jan 1, 2009
7.19 bln
+4.959 bln
222.26%
Ranking of countries by current statistics by years