Download This statistics in other country:
Timeline:
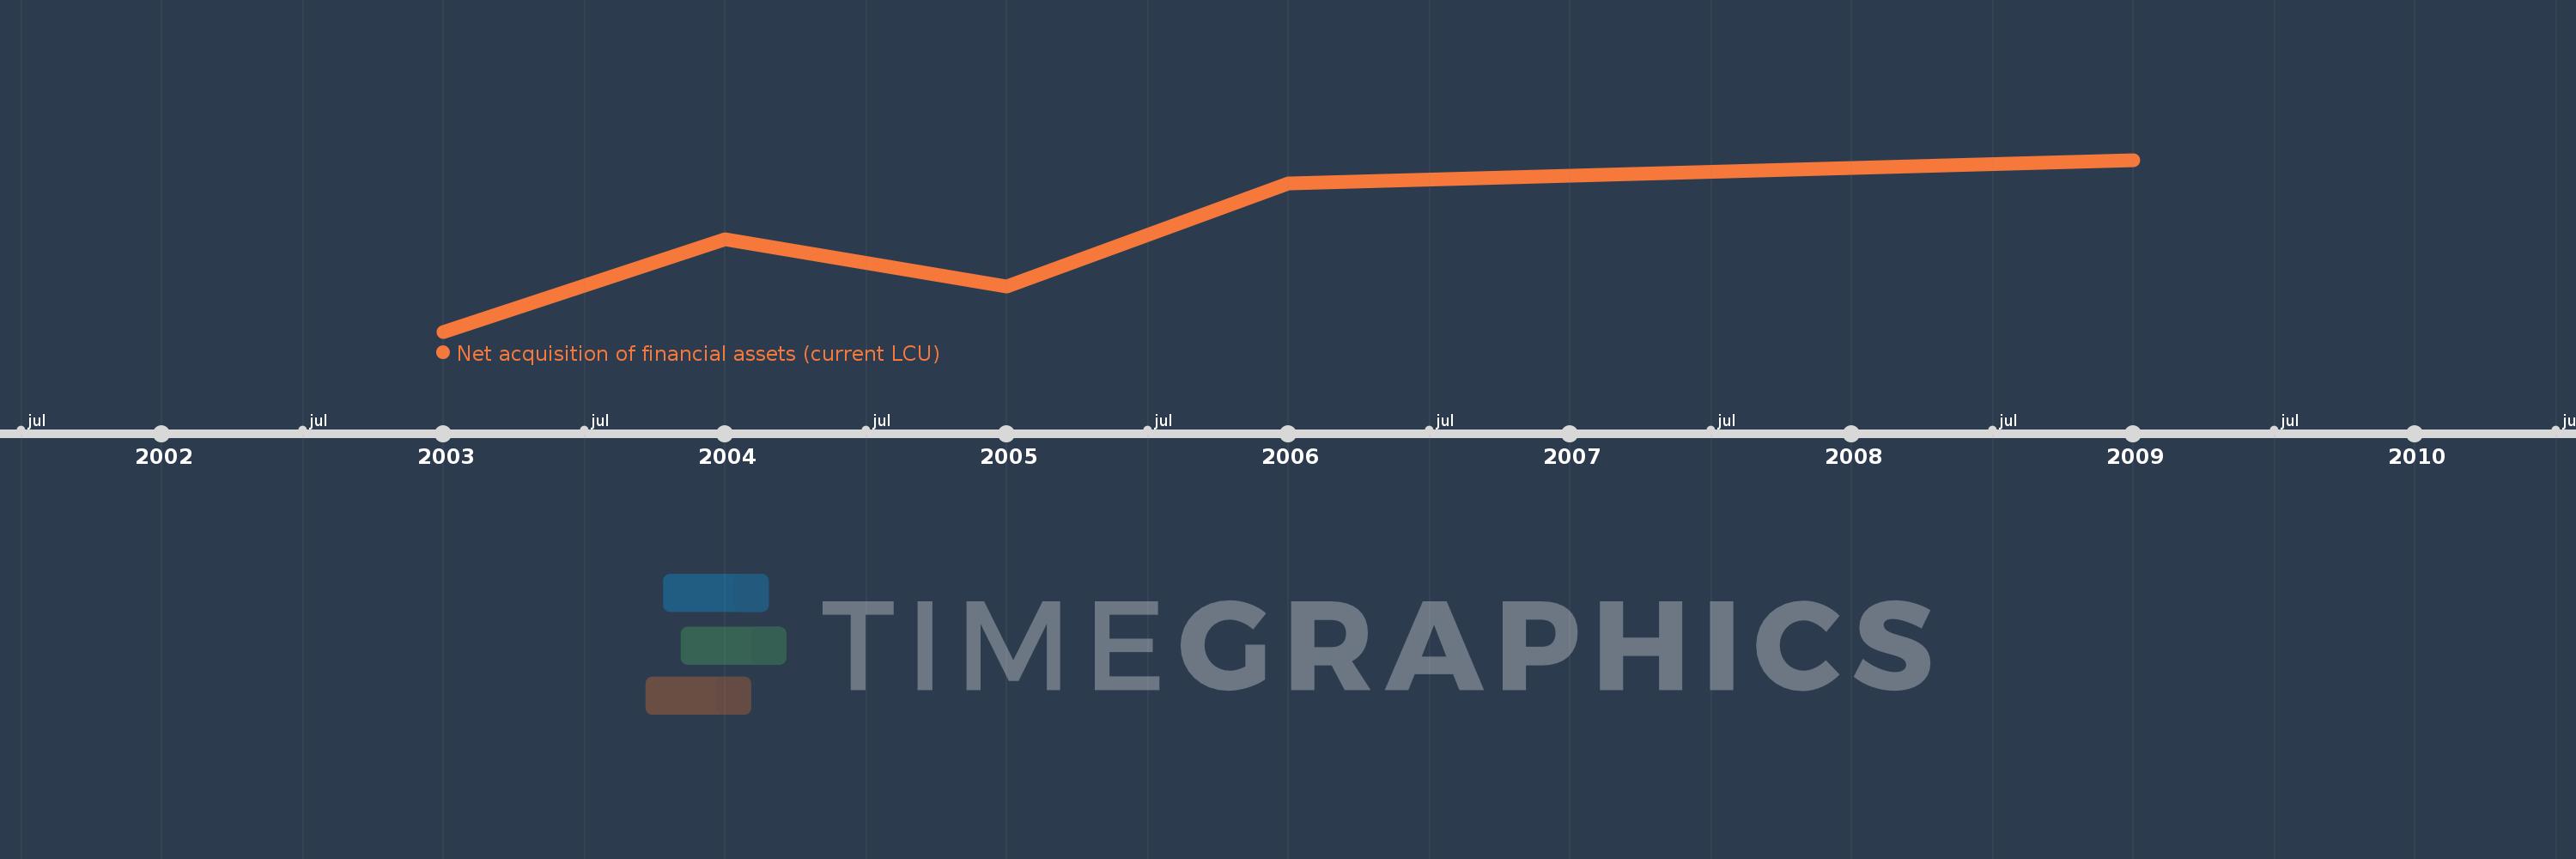
This timeline shows a graph from 2003 to 2009 of New Zealand. No data until 2002. Number of actual observations by date: 5.
Source name:
World Development Indicators
Source organization:
International Monetary Fund, Government Finance Statistics Yearbook and data files.
Categories, topics:
Public Sector
Last updated:
apr 23, 2017
Indicators value changes by year
Minimum:
2.701 bln
jan 1, 2003
Maximum:
9.696 bln
jan 1, 2009
At the date of observation
Value
Absolute change
Change from the previous value
jan 1, 2003
2.701 bln
+2.701 bln
0.0%
jan 1, 2004
6.449 bln
+3.748 bln
138.79%
jan 1, 2005
4.544 bln
-1.905 bln
-29.54%
jan 1, 2006
8.737 bln
+4.193 bln
92.28%
jan 1, 2009
9.696 bln
+958.8 mln
10.97%
Ranking of countries by current statistics by years