Download This statistics in other country:
Timeline:
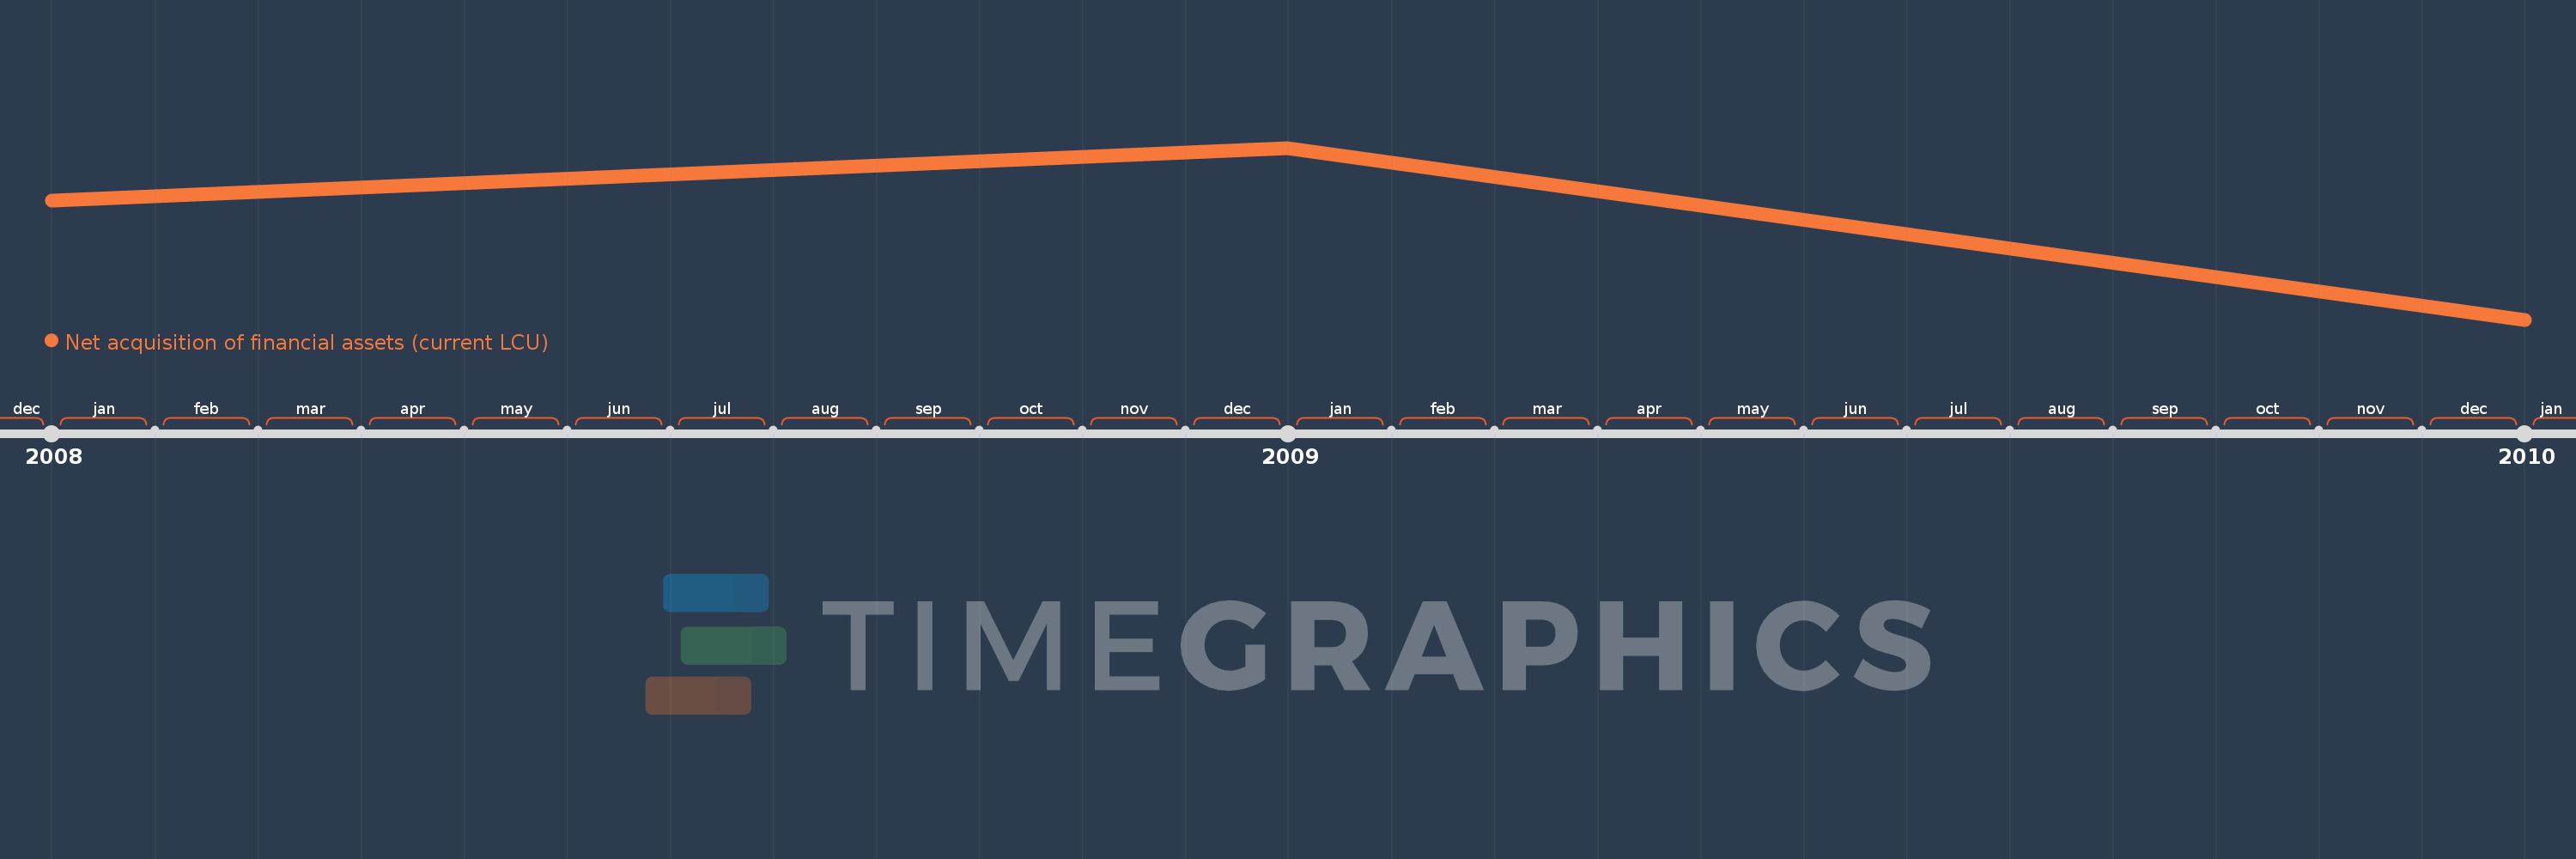
This timeline shows a graph from 2008 to 2010 of Equatorial Guinea. No data until 2007. Number of actual observations by date: 3.
Source name:
World Development Indicators
Source organization:
International Monetary Fund, Government Finance Statistics Yearbook and data files.
Categories, topics:
Public Sector
Last updated:
apr 23, 2017
Indicators value changes by year
Minimum:
-149.528 bln
jan 1, 2010
Maximum:
1.452 trl
jan 1, 2009
At the date of observation
Value
Absolute change
Change from the previous value
jan 1, 2008
964.011 bln
+964.011 bln
0.0%
jan 1, 2009
1.452 trl
+487.938 bln
50.62%
jan 1, 2010
-149.528 bln
-1.601 trl
-110.3%
Ranking of countries by current statistics by years