Download This statistics in other country:
Timeline:
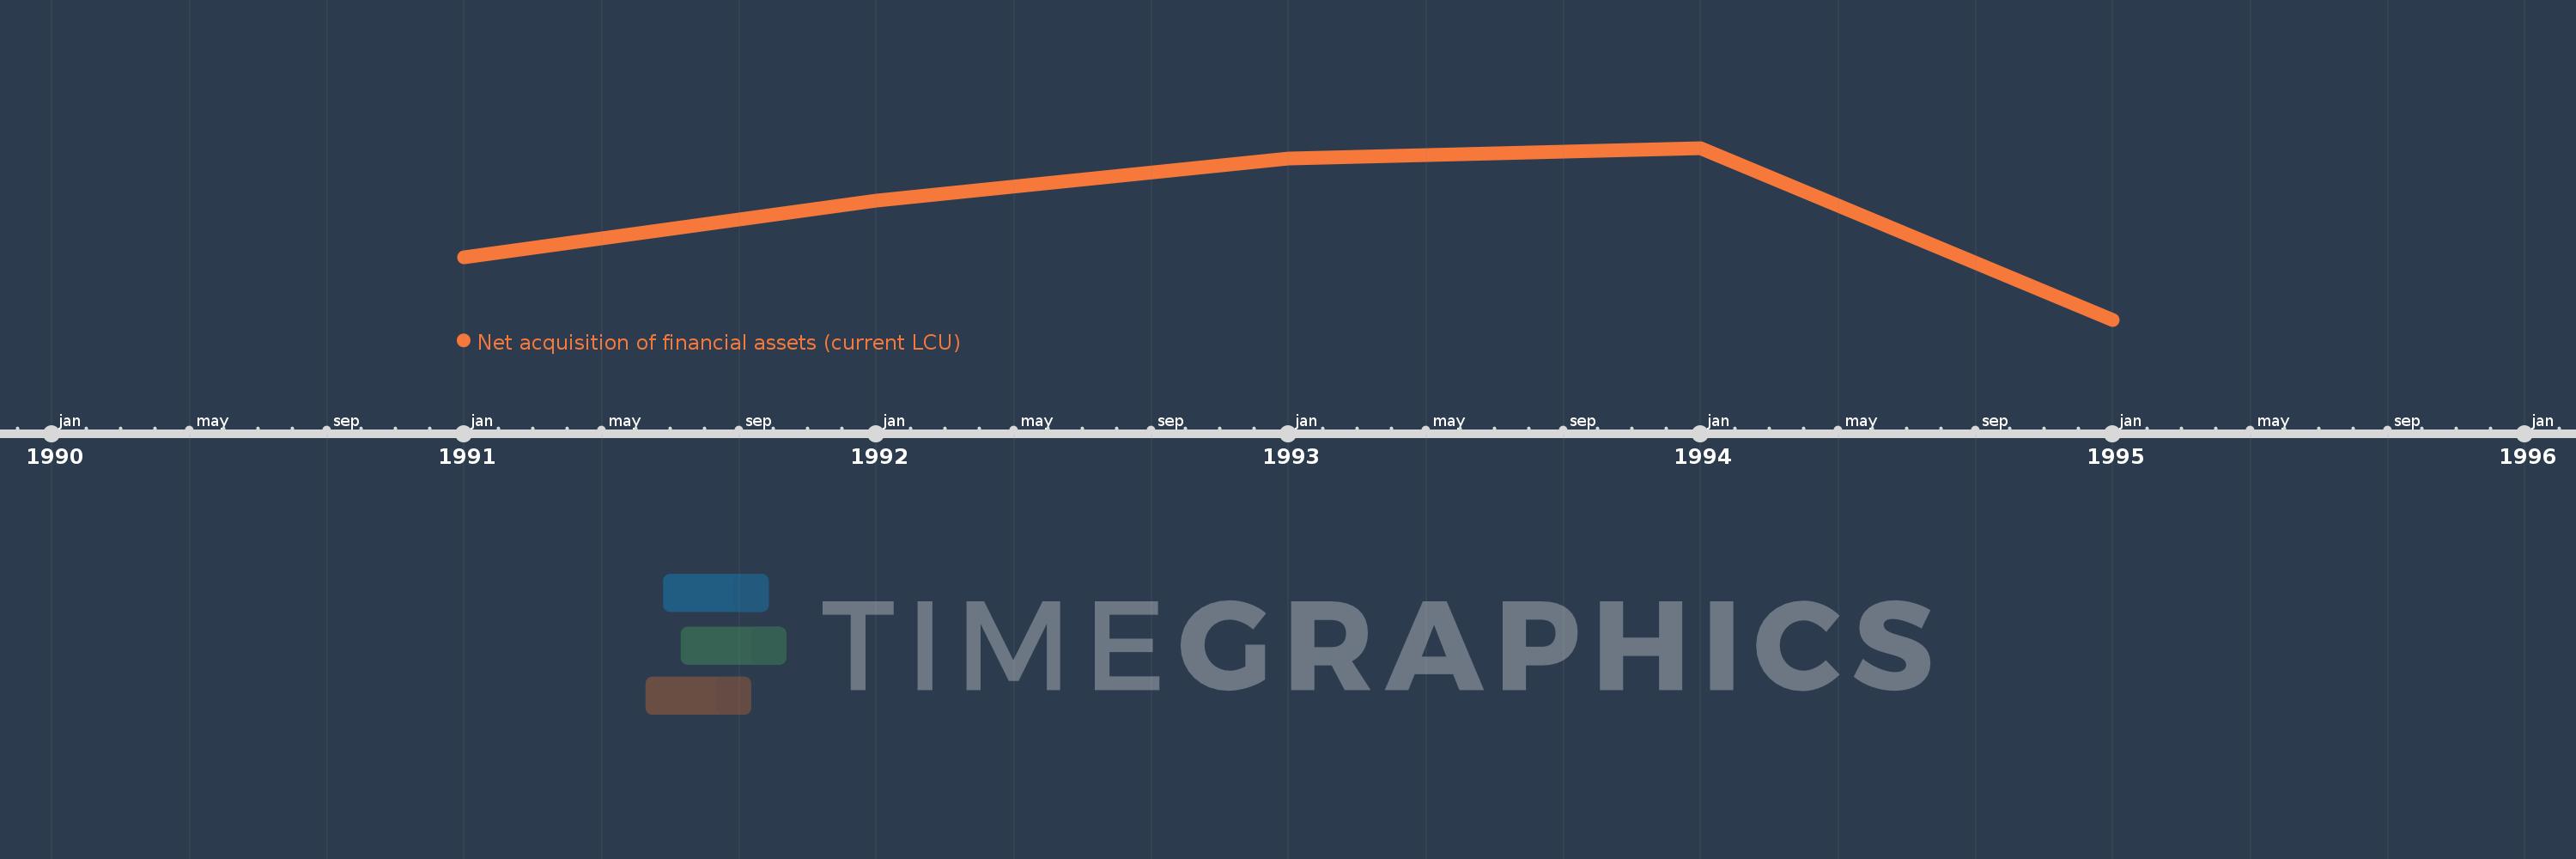
This timeline shows a graph from 1991 to 1995 of Cyprus. No data until 1990. Number of actual observations by date: 5.
Source name:
World Development Indicators
Source organization:
International Monetary Fund, Government Finance Statistics Yearbook and data files.
Categories, topics:
Public Sector
Last updated:
apr 23, 2017
Indicators value changes by year
Minimum:
-17.603 mln
jan 1, 1995
Maximum:
194.339 mln
jan 1, 1994
At the date of observation
Value
Absolute change
Change from the previous value
jan 1, 1991
59.262 mln
+59.262 mln
0.0%
jan 1, 1992
129.326 mln
+70.064 mln
118.23%
jan 1, 1993
181.465 mln
+52.139 mln
40.32%
jan 1, 1994
194.339 mln
+12.874 mln
7.09%
jan 1, 1995
-17.603 mln
-211.943 mln
-109.06%
Ranking of countries by current statistics by years