33
/
AIzaSyB4mHJ5NPEv-XzF7P6NDYXjlkCWaeKw5bc
November 30, 2025
94511
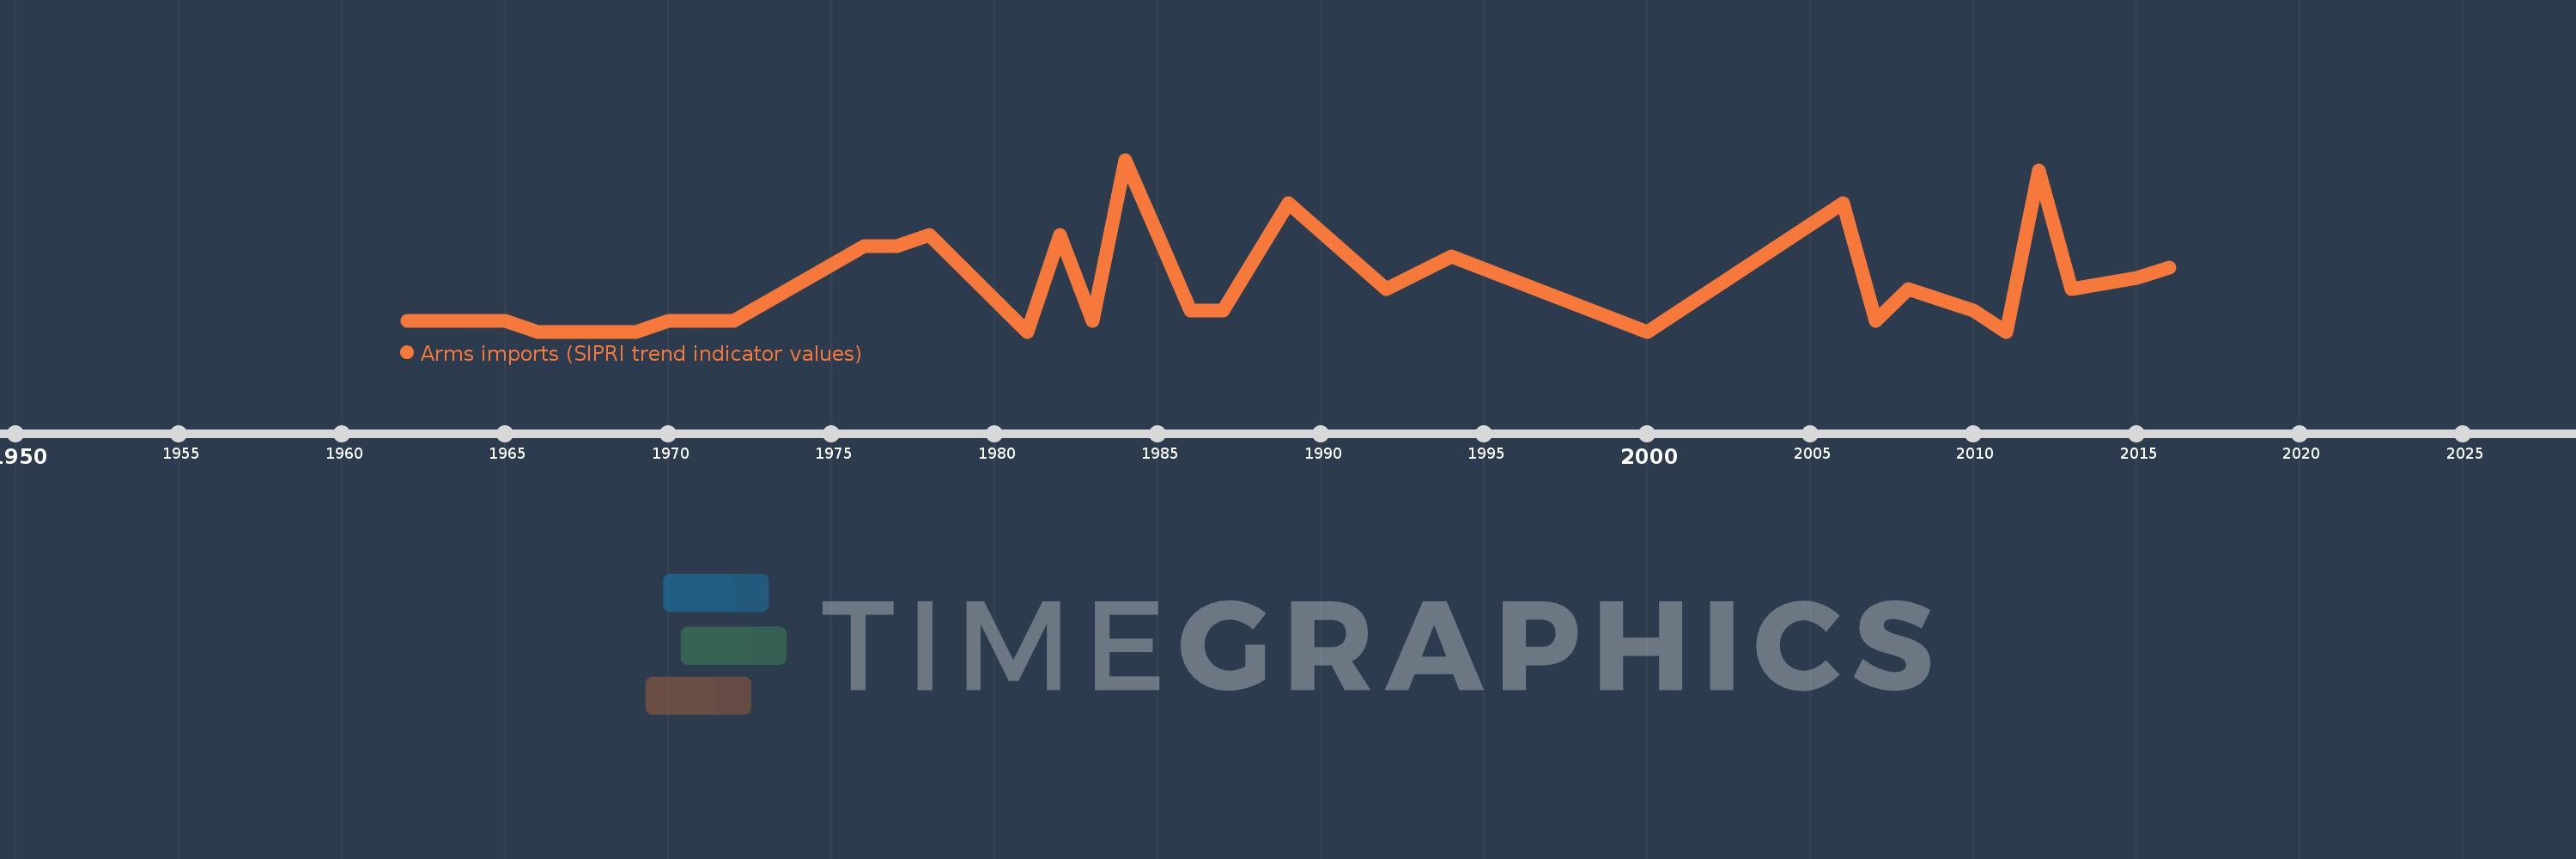
Burkina Faso
BFA
true
2
1
Arms imports (SIPRI trend indicator values)
2016,2015,2013,2012,2011,2010,2008,2007,2006,2000,1994,1992,1989,1987,1986,1985,1984,1983,1982,1981,1978,1977,1976,1972,1971,1970,1969,1967,1966,1965,1962