33
/
AIzaSyB4mHJ5NPEv-XzF7P6NDYXjlkCWaeKw5bc
November 30, 2025
34777
Heavily indebted poor countries (HIPC)
HPC
false
2
1
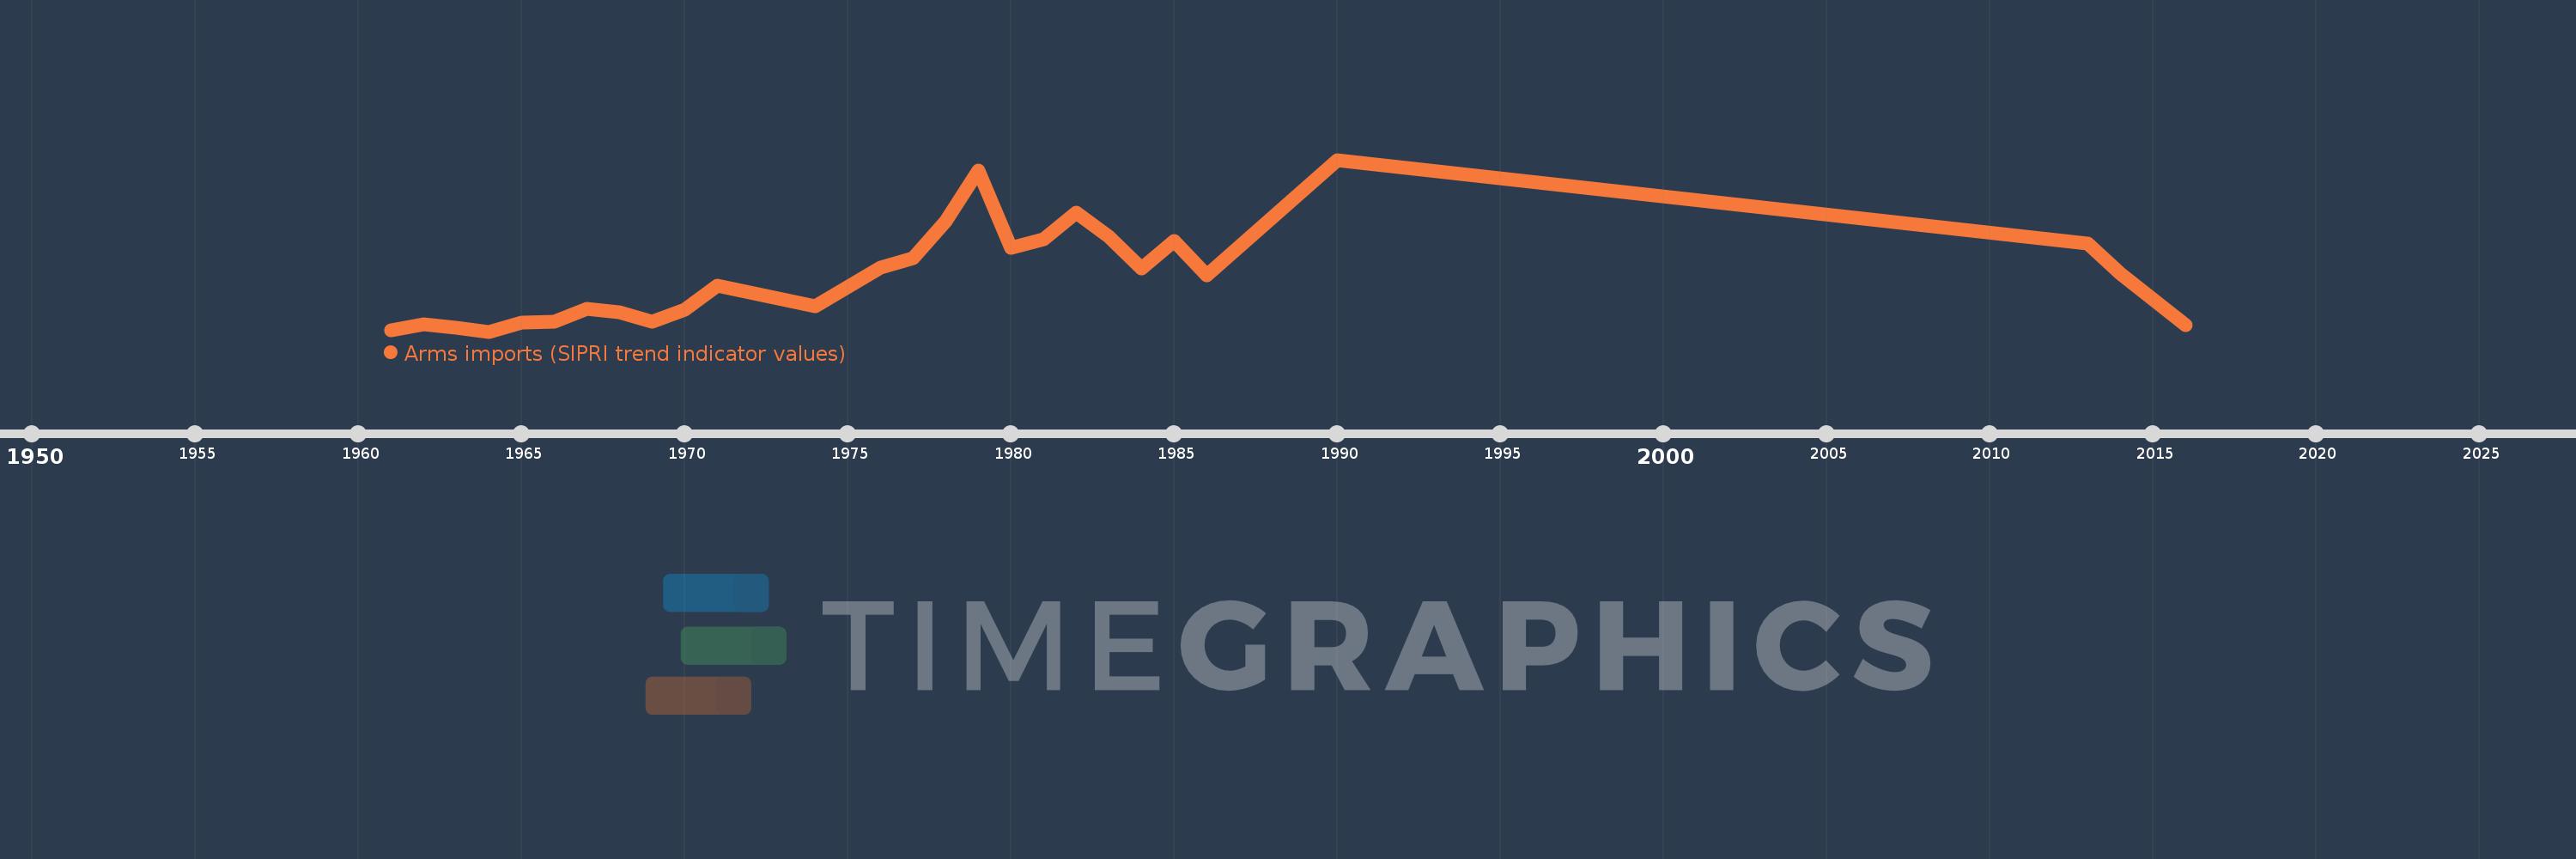
Arms imports (SIPRI trend indicator values)
2016,2014,2013,1990,1986,1985,1984,1983,1982,1981,1980,1979,1978,1977,1976,1974,1971,1970,1969,1968,1967,1966,1965,1964,1963,1962,1961