33
/
AIzaSyB4mHJ5NPEv-XzF7P6NDYXjlkCWaeKw5bc
November 30, 2025
286850
Zimbabwe
ZWE
true
2
1
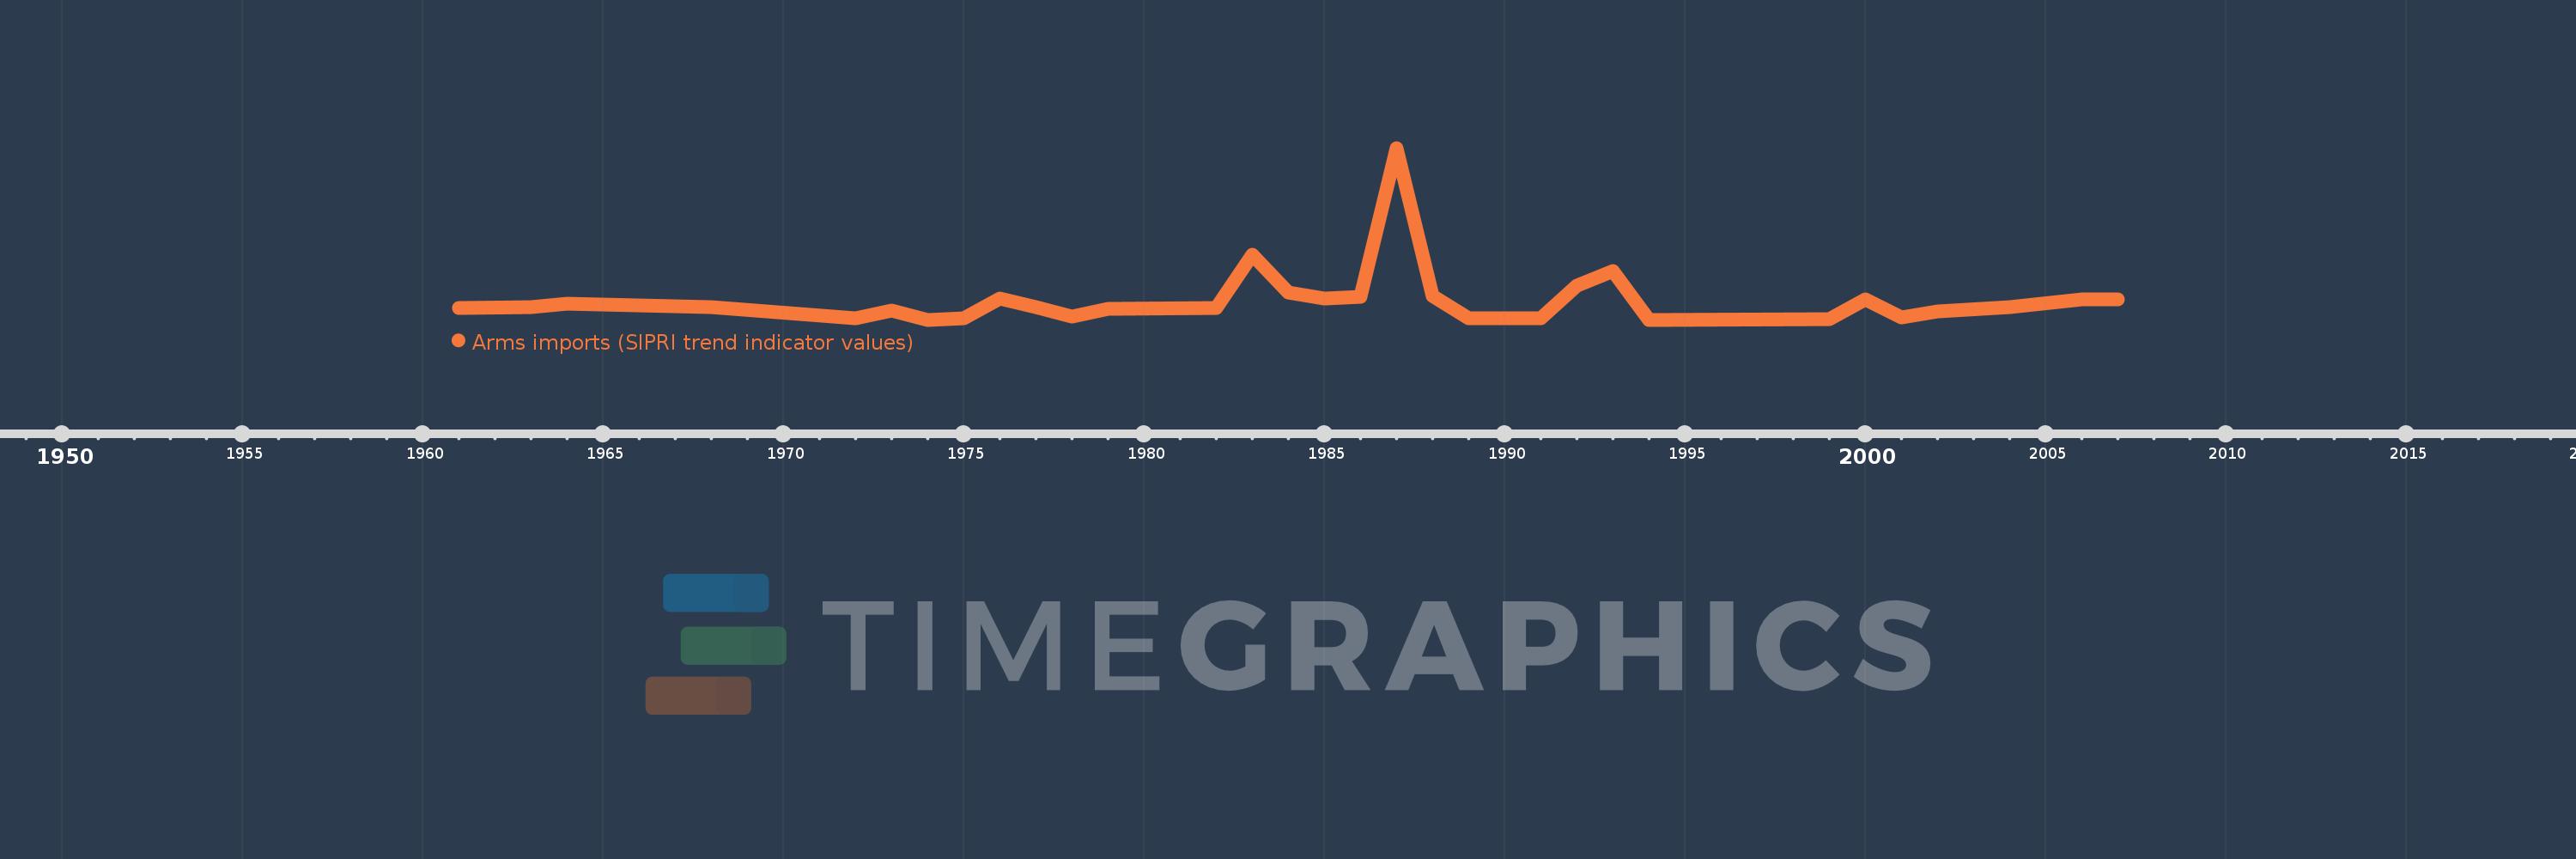
Arms imports (SIPRI trend indicator values)
2007,2006,2004,2002,2001,2000,1999,1994,1993,1992,1991,1989,1988,1987,1986,1985,1984,1983,1982,1979,1978,1977,1976,1975,1974,1973,1972,1968,1964,1963,1961