33
/
AIzaSyB4mHJ5NPEv-XzF7P6NDYXjlkCWaeKw5bc
November 30, 2025
217974
Panama
PAN
true
2
1
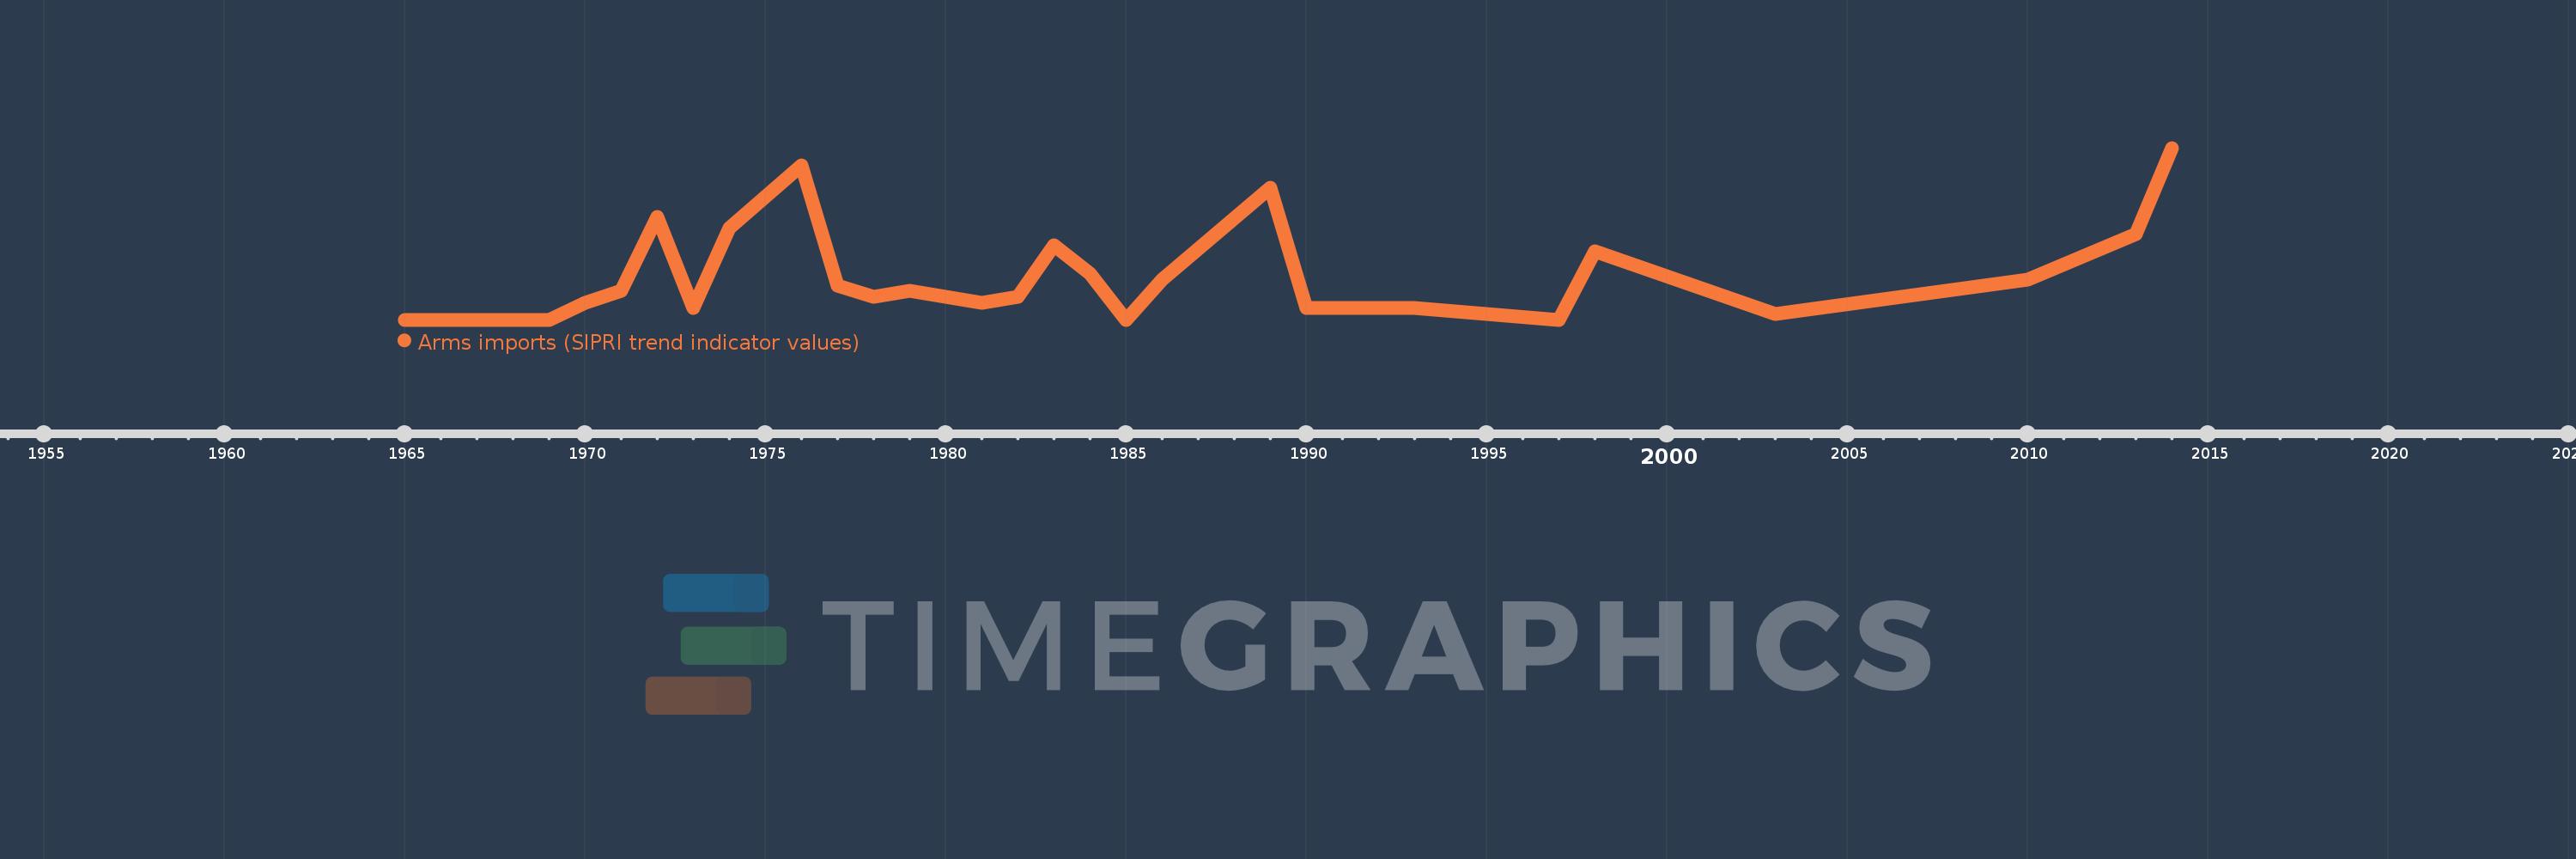
Arms imports (SIPRI trend indicator values)
2014,2013,2010,2003,1998,1997,1993,1990,1989,1986,1985,1984,1983,1982,1981,1979,1978,1977,1976,1974,1973,1972,1971,1970,1969,1965