33
/
AIzaSyB4mHJ5NPEv-XzF7P6NDYXjlkCWaeKw5bc
November 30, 2025
86556
Bhutan
BTN
true
2
1
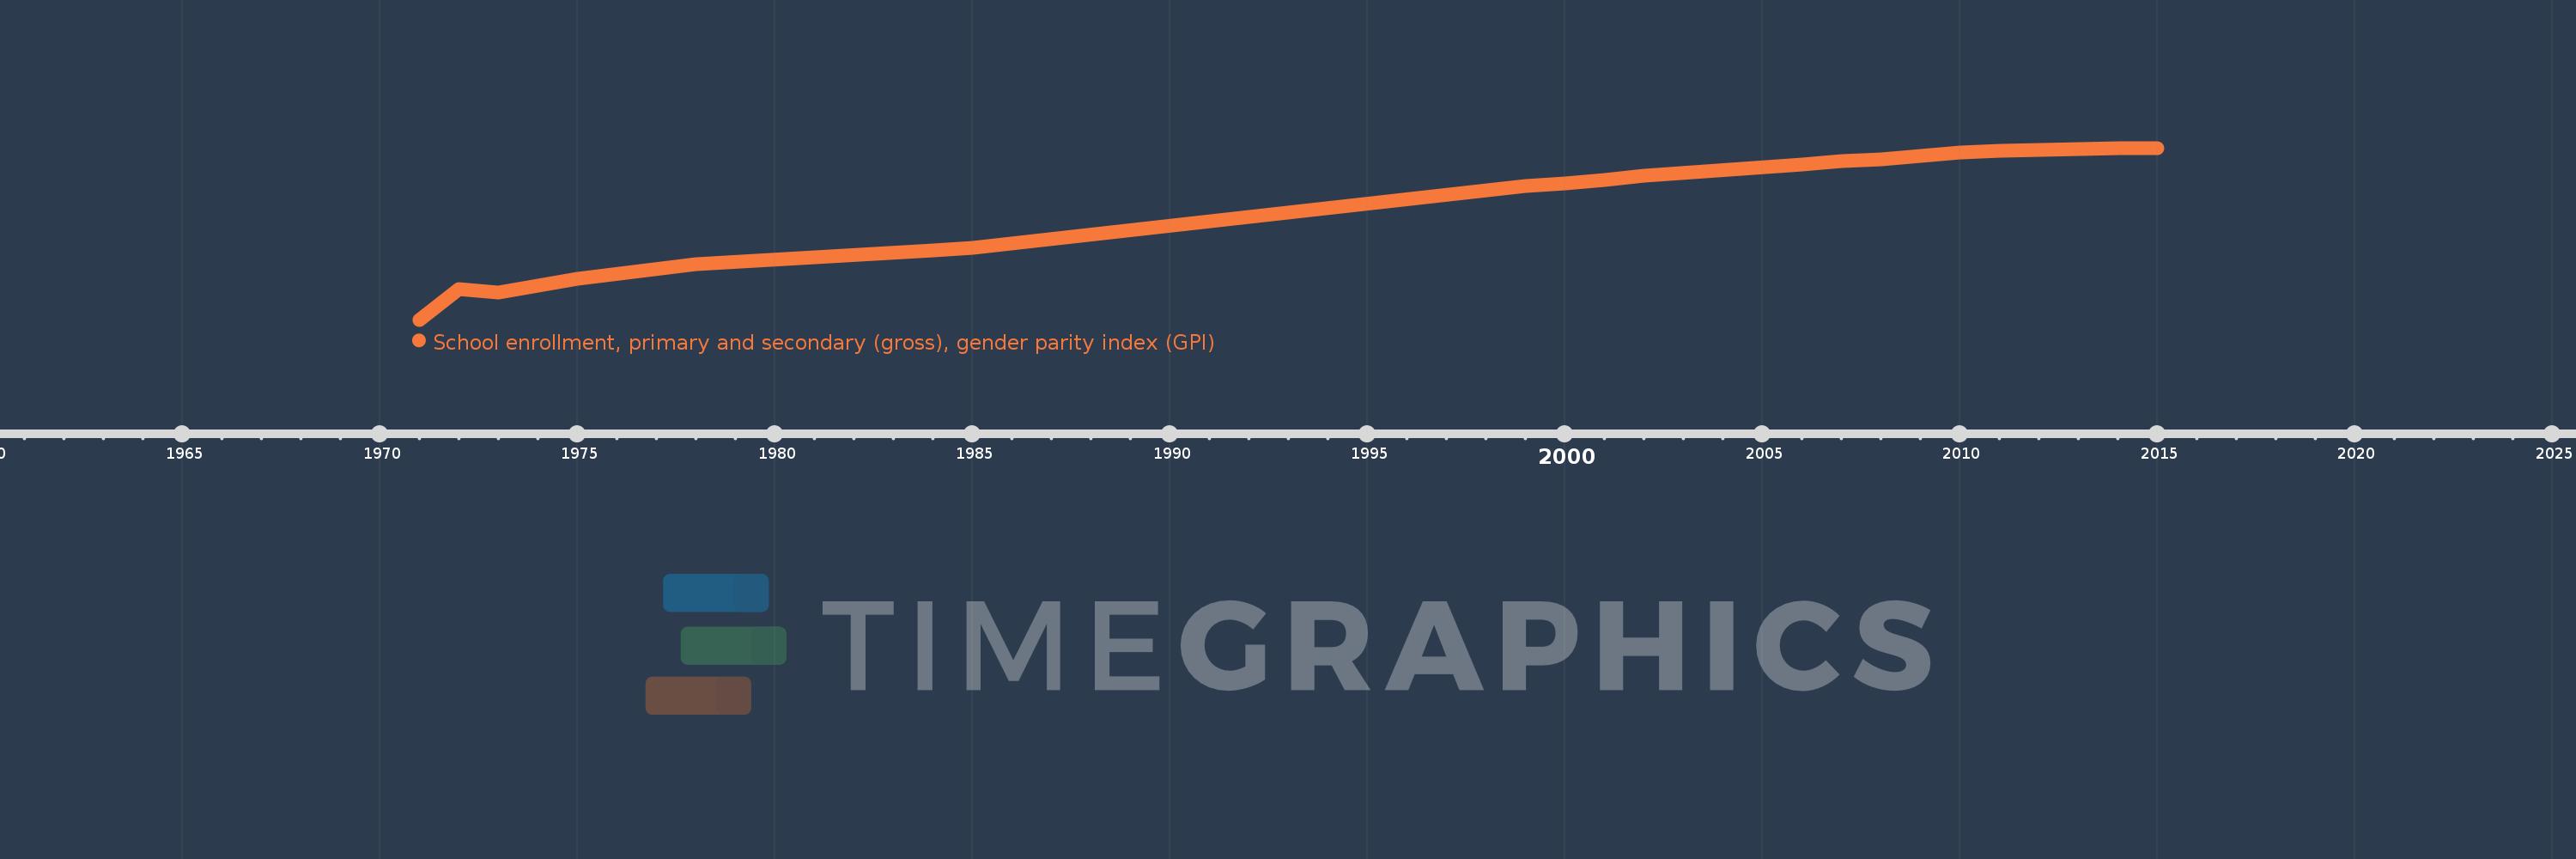
School enrollment, primary and secondary (gross), gender parity index (GPI)
2015,2014,2013,2012,2011,2010,2009,2008,2007,2006,2002,2001,2000,1999,1985,1984,1978,1975,1973,1972,1971