33
/
AIzaSyB4mHJ5NPEv-XzF7P6NDYXjlkCWaeKw5bc
November 30, 2025
148575
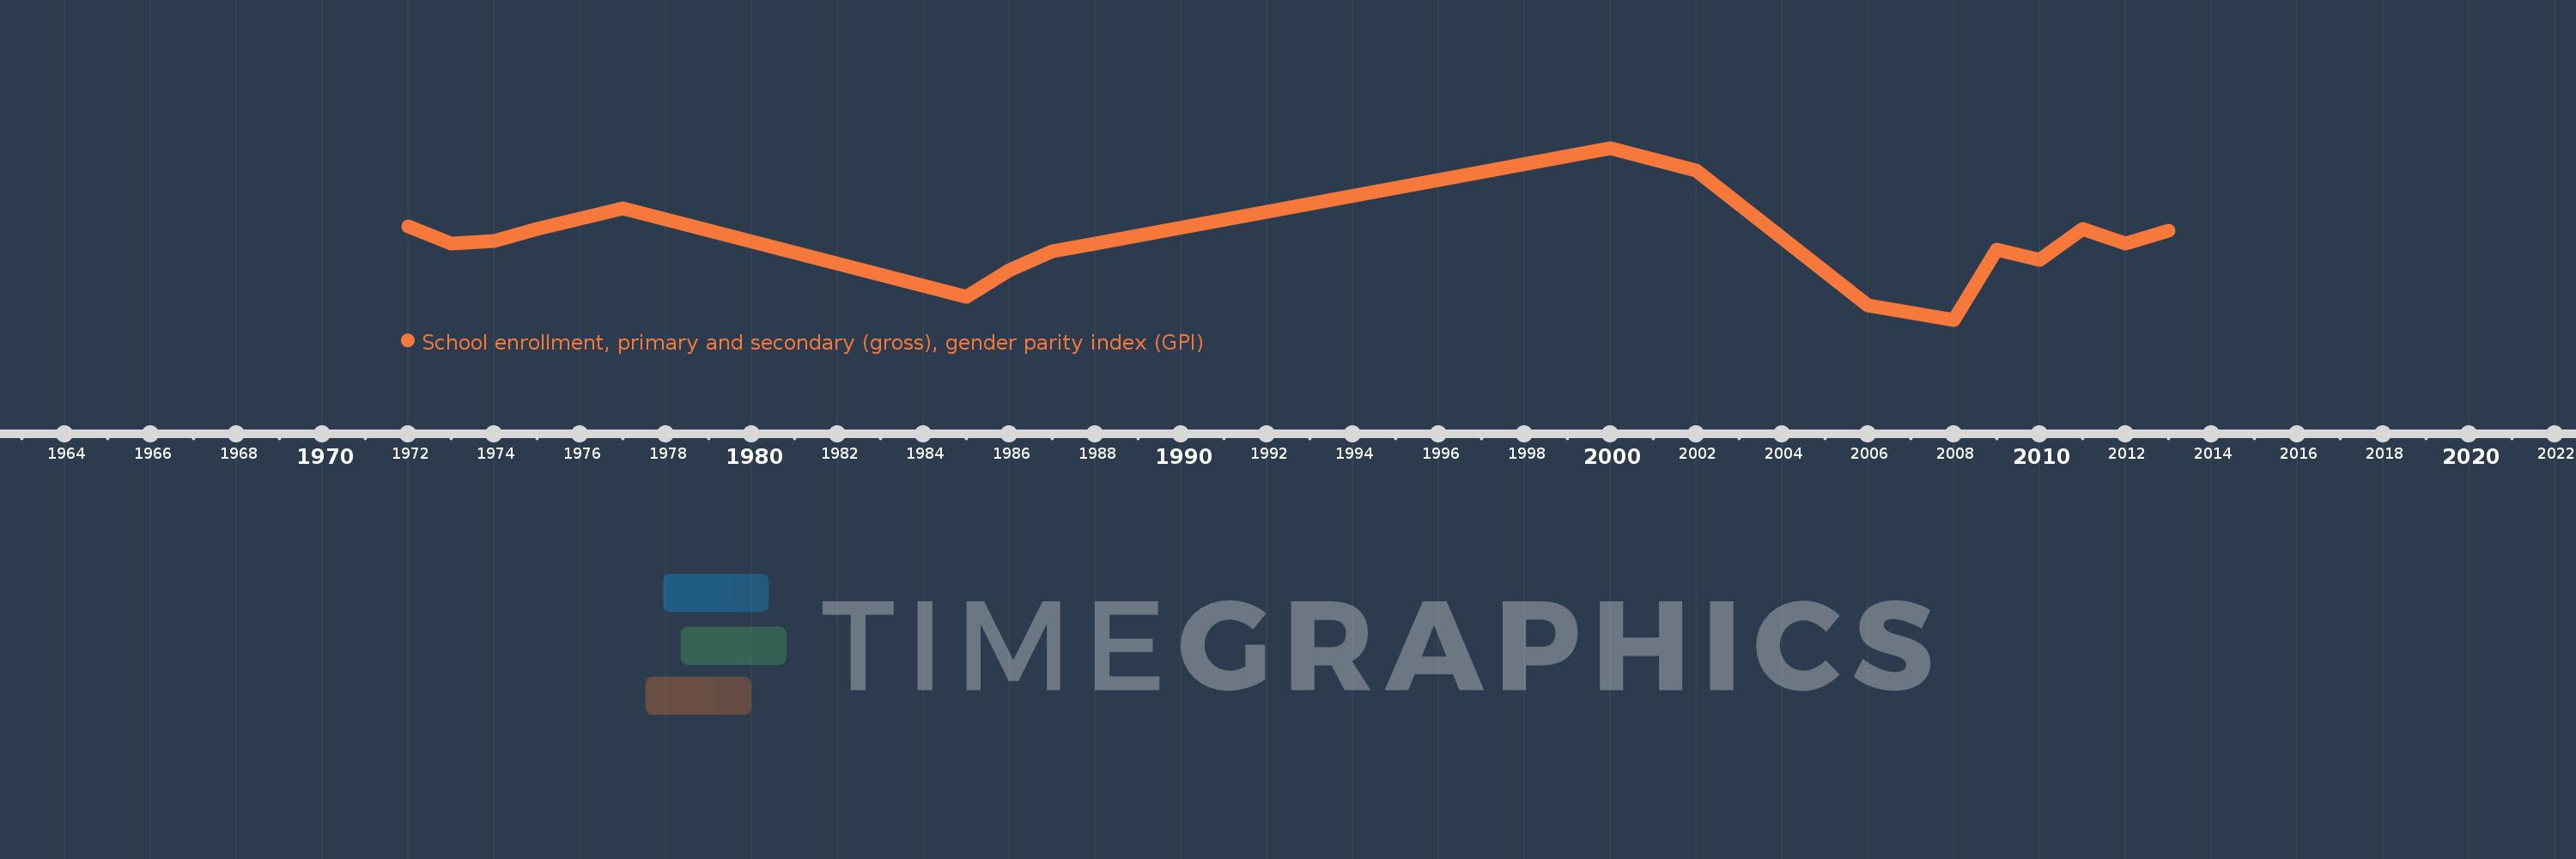
Guyana
GUY
true
2
1
School enrollment, primary and secondary (gross), gender parity index (GPI)
2013,2012,2011,2010,2009,2008,2006,2002,2000,1988,1987,1986,1985,1977,1975,1974,1973,1972