33
/
AIzaSyB4mHJ5NPEv-XzF7P6NDYXjlkCWaeKw5bc
November 30, 2025
280374
Vanuatu
VUT
true
2
1
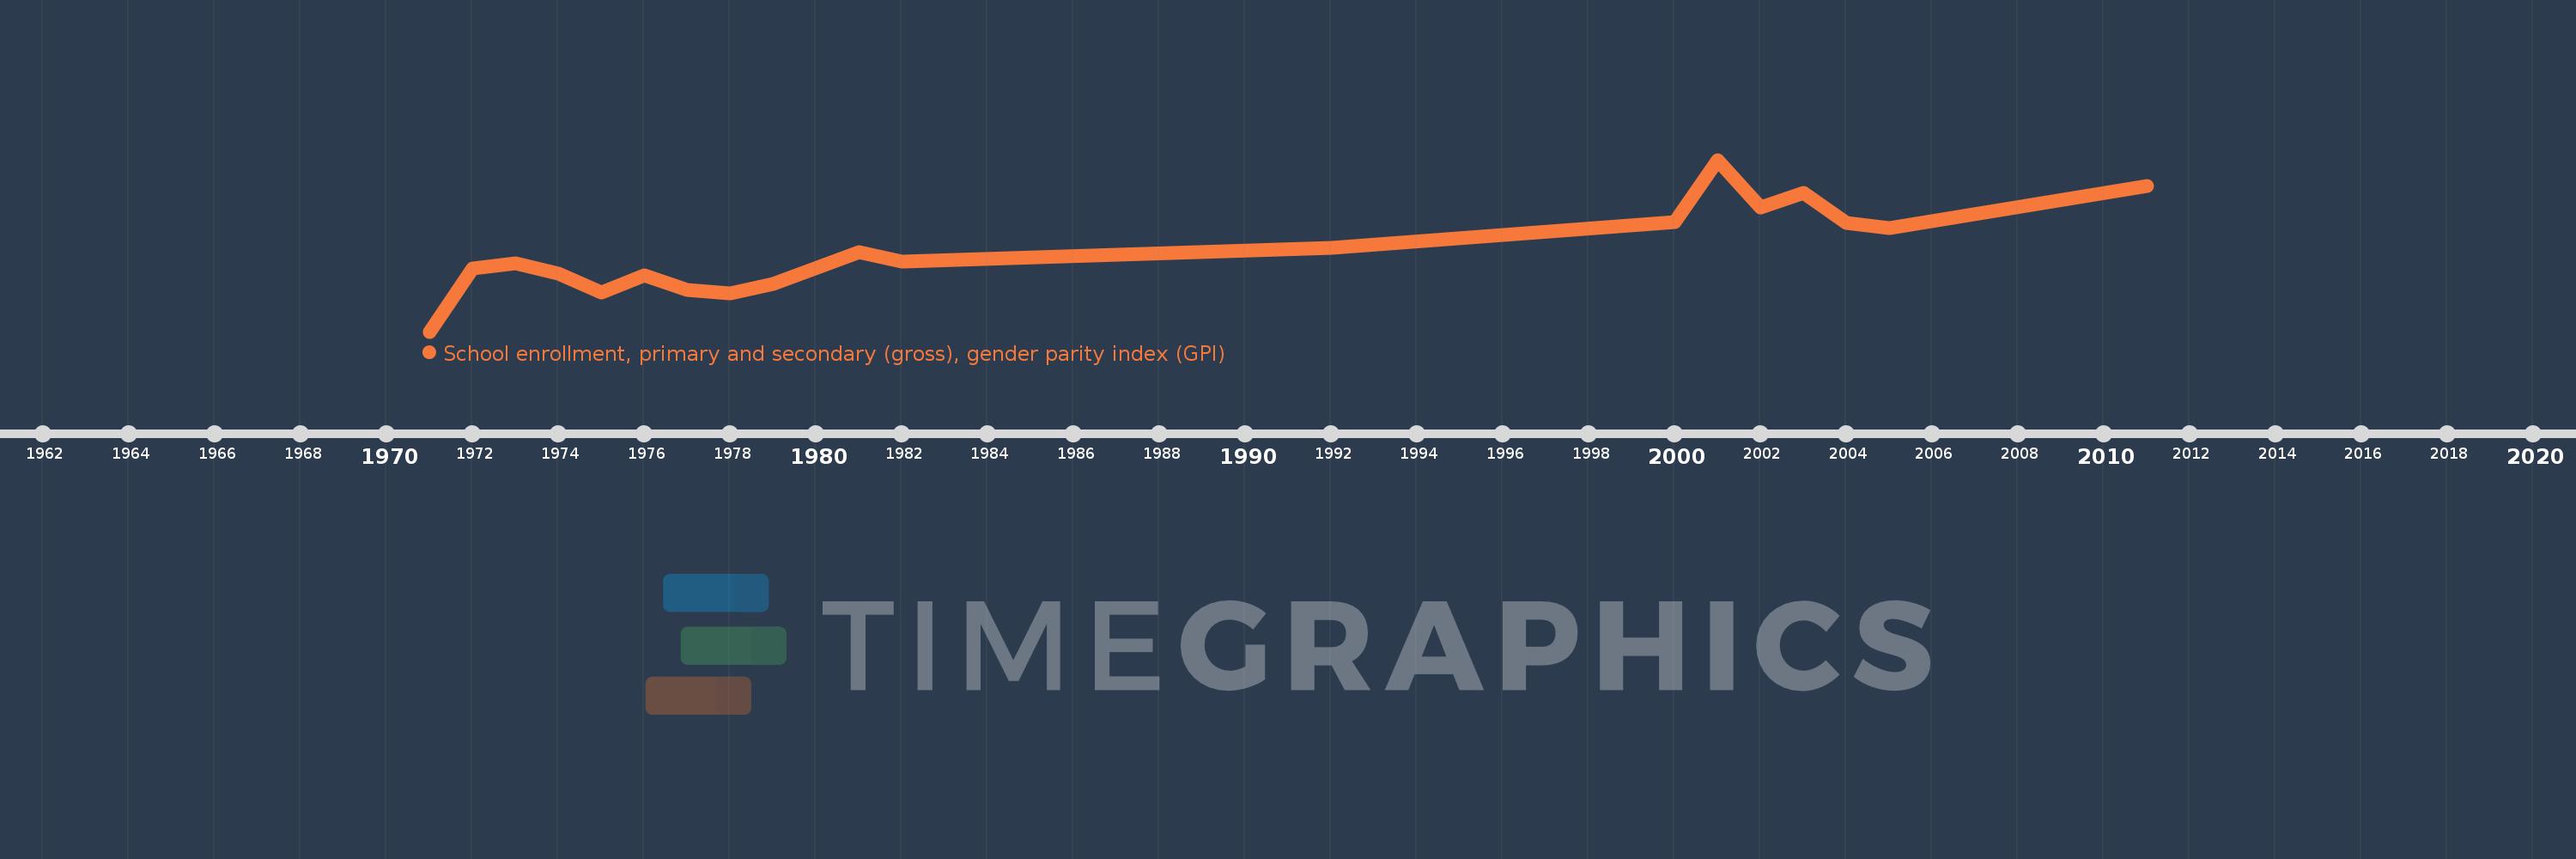
School enrollment, primary and secondary (gross), gender parity index (GPI)
2011,2005,2004,2003,2002,2001,2000,1992,1982,1981,1979,1978,1977,1976,1975,1974,1973,1972,1971