33
/
AIzaSyB4mHJ5NPEv-XzF7P6NDYXjlkCWaeKw5bc
November 30, 2025
254620
Suriname
SUR
true
2
1
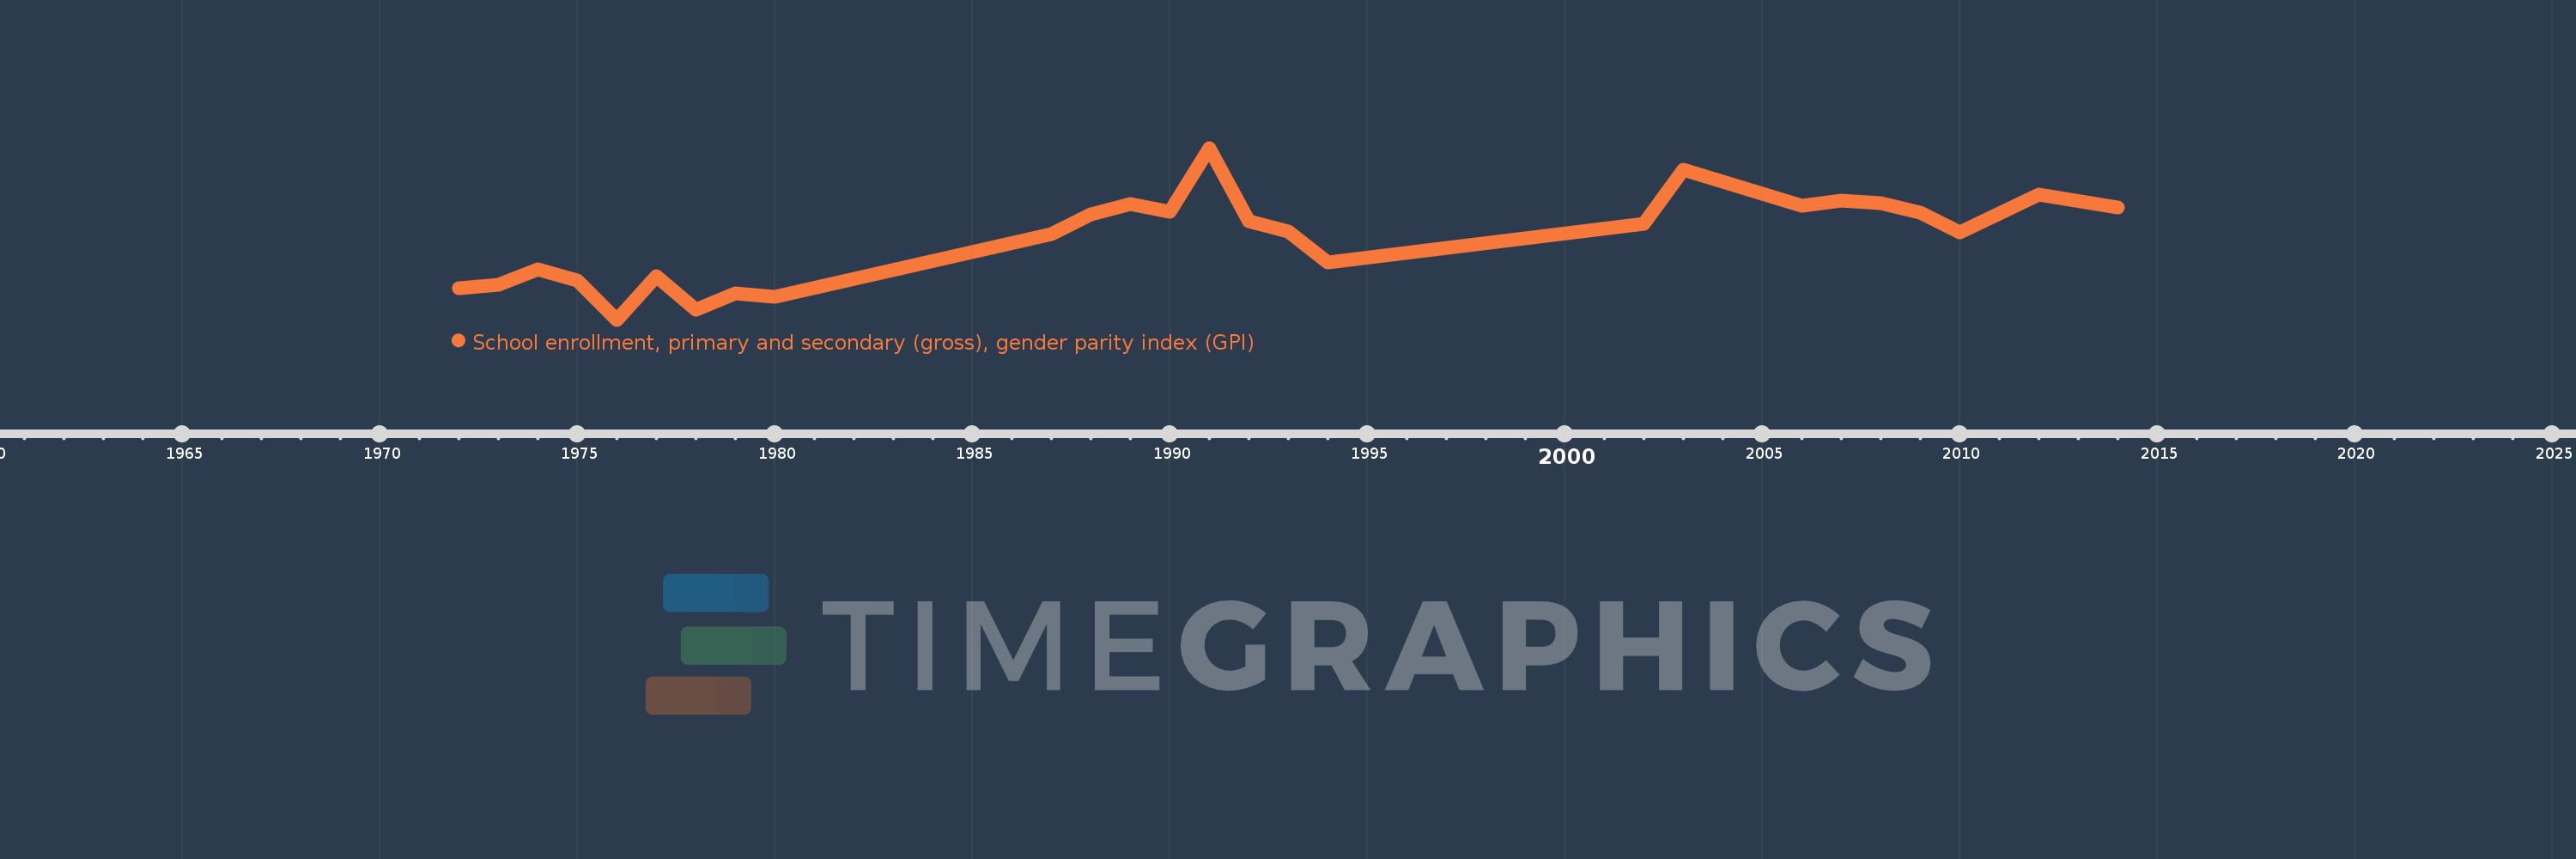
School enrollment, primary and secondary (gross), gender parity index (GPI)
2014,2012,2010,2009,2008,2007,2006,2003,2002,1994,1993,1992,1991,1990,1989,1988,1987,1980,1979,1978,1977,1976,1975,1974,1973,1972