33
/
AIzaSyB4mHJ5NPEv-XzF7P6NDYXjlkCWaeKw5bc
November 30, 2025
85894
Bhutan
BTN
true
2
1
Female legislators, senior officials and managers (% of total)
2014,2013,2012,2011,2010,2007,2006
Create a timeline
Public Timelines
For education
For educational institutions
For teachers
For students
Cabinet
For educational institutions
For teachers
For students
Open cabinet
FAQ
Close
Create a timeline
Public timelines
FAQ
About & Feedback
Terms
Privacy
FAQ
Support 24/7
Cabinet
Get premium
Donate
Download
Global statistics library
→
Bhutan
→
Female legislators, senior officials and managers (% of total)
This statistics in other country:
Albania
Algeria
Antigua and Barbuda
Argentina
Armenia
Aruba
Australia
Austria
Azerbaijan
Bahamas, The
Bahrain
Bangladesh
Barbados
Belarus
Belgium
Belize
Bermuda
Bhutan
Bolivia
Botswana
Brazil
Brunei Darussalam
Bulgaria
Burkina Faso
Cambodia
Canada
Cayman Islands
Chile
China
Colombia
Costa Rica
Croatia
Cyprus
Czech Republic
Denmark
Dominica
Dominican Republic
Ecuador
Egypt, Arab Rep.
El Salvador
Eritrea
Estonia
Ethiopia
Fiji
Finland
France
Georgia
Germany
Greece
Grenada
Guyana
Hong Kong SAR, China
Hungary
Iceland
India
Indonesia
Iran, Islamic Rep.
Ireland
Israel
Italy
Jordan
Kazakhstan
Kiribati
Korea, Rep.
Kosovo
Kuwait
Kyrgyz Republic
Lao PDR
Latvia
Lebanon
Lesotho
Lithuania
Luxembourg
Macao SAR, China
Macedonia, FYR
Madagascar
Malaysia
Maldives
Malta
Mauritius
Mexico
Moldova
Mongolia
Montenegro
Morocco
Namibia
Nepal
Netherlands
New Zealand
Nicaragua
Norway
Oman
Pakistan
Panama
Paraguay
Peru
Philippines
Poland
Portugal
Puerto Rico
Qatar
Romania
Russian Federation
Samoa
San Marino
Sao Tome and Principe
Saudi Arabia
Serbia
Singapore
Slovak Republic
Slovenia
South Africa
Spain
Sri Lanka
St. Lucia
St. Vincent and the Grenadines
Suriname
Sweden
Switzerland
Syrian Arab Republic
Tanzania
Thailand
Timor-Leste
Tonga
Trinidad and Tobago
Turkey
Tuvalu
Uganda
Ukraine
United Arab Emirates
United Kingdom
United States
Uruguay
Vanuatu
Vietnam
West Bank and Gaza
Yemen, Rep.
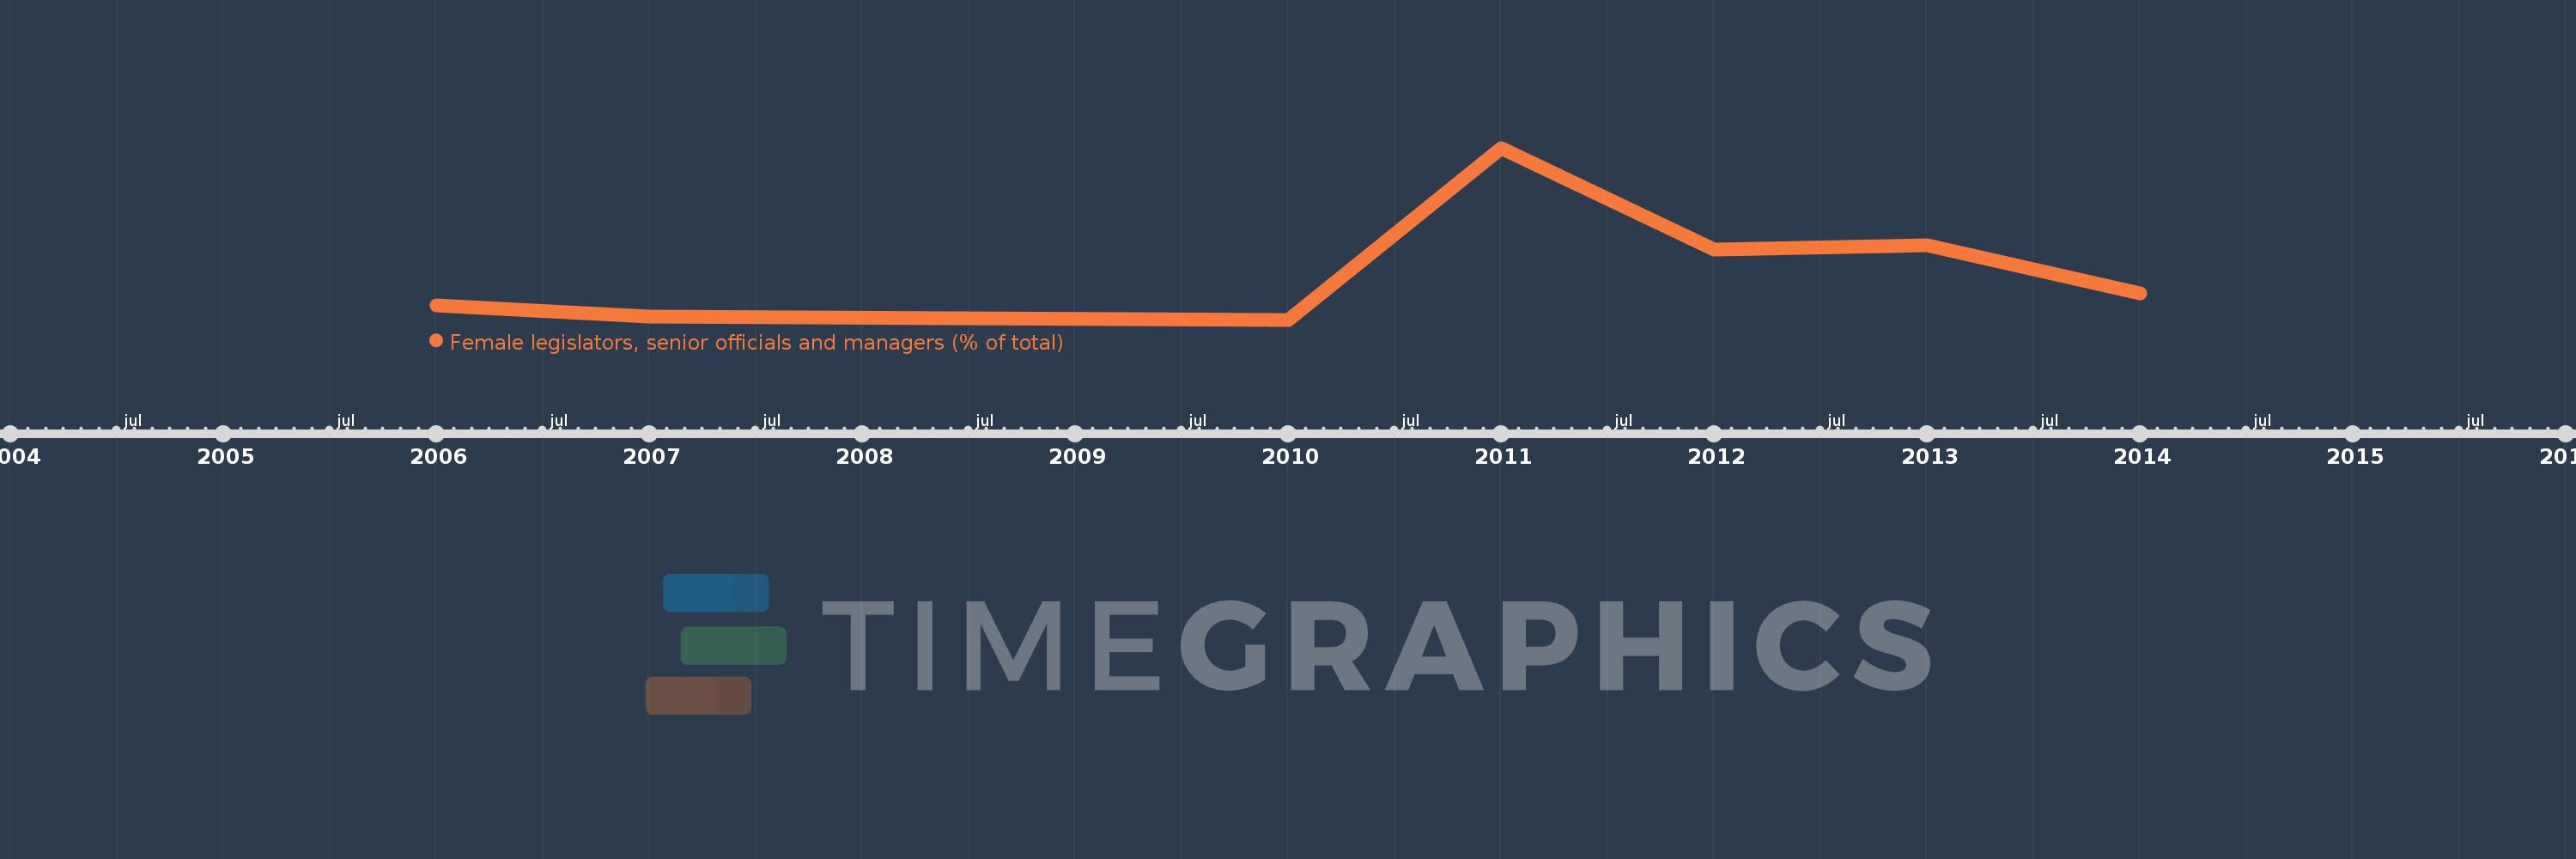
Timeline:
This timeline shows a graph from
2006
to
2014
of Bhutan. No data until
2005
. Number of actual observations by date:
7
.
Source name:
World Development Indicators
Source organization:
ILO Key Indicators of the Labour Market (KILM).
Categories, topics:
Public Sector, Gender
Last updated:
apr 23, 2017
Indicators value changes by year
Meaning:
22.58
Minimum:
11.224
jan 1, 2010
Maximum:
49.231
jan 1, 2011
At the date of observation
Value
Absolute change
Change from the previous value
jan 1, 2006
14.36
+14.36
0.0%
jan 1, 2007
12.0
-2.36
-16.43%
jan 1, 2010
11.224
-0.776
-6.47%
jan 1, 2011
49.231
+38.007
338.63%
jan 1, 2012
26.667
-22.564
-45.83%
jan 1, 2013
27.613
+0.946
3.55%
jan 1, 2014
16.967
-10.645
-38.55%
Ranking of countries by current statistics by years
About & Feedback
Terms
Privacy
FAQ
Support 24/7
Cabinet
Get premium
Donate
The service accepts bank transfer (ACH, Wire) or cards (Visa, MasterCard, etc). Processed by Stripe.
Secured with SSL