Download This statistics in other country:
Timeline:
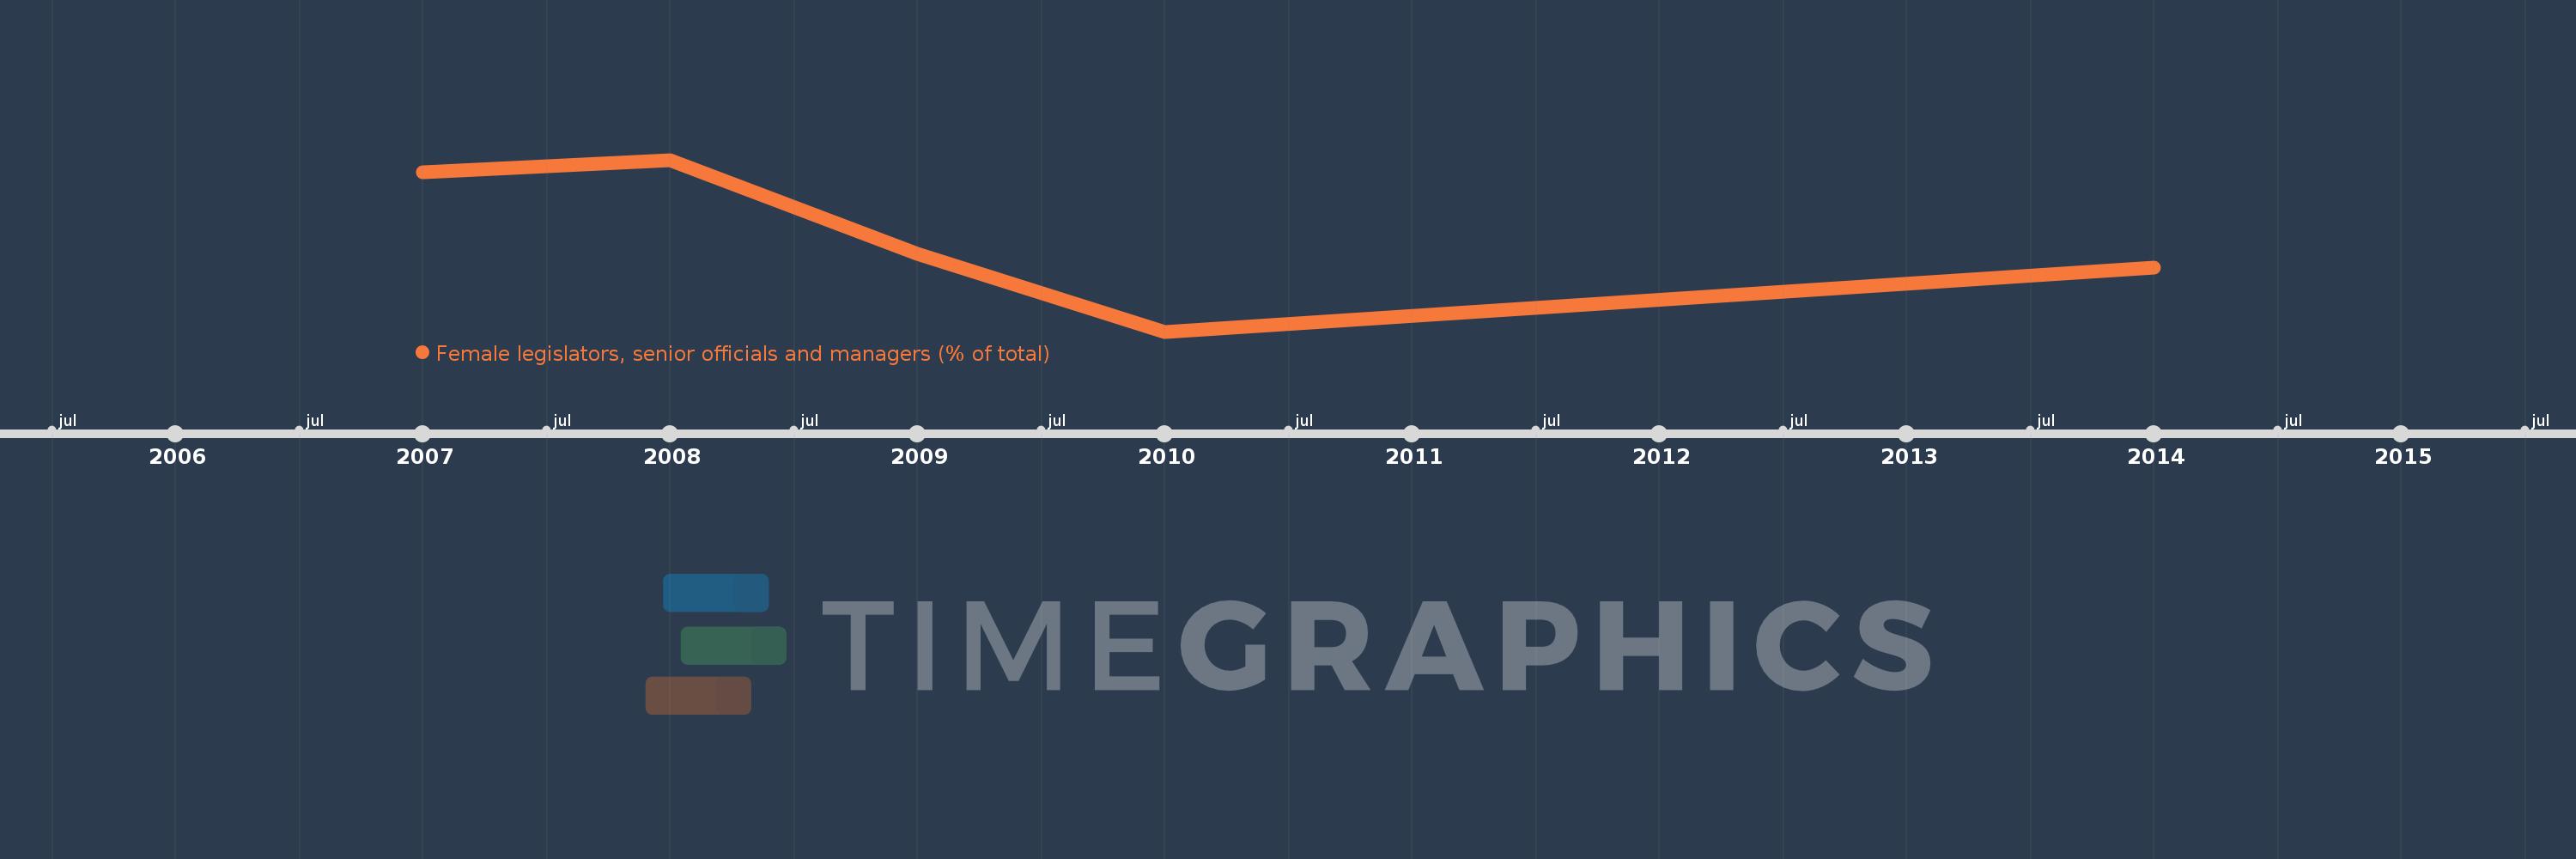
This timeline shows a graph from 2007 to 2014 of Saudi Arabia. No data until 2006. Number of actual observations by date: 5.
Source name:
World Development Indicators
Source organization:
ILO Key Indicators of the Labour Market (KILM).
Categories, topics:
Public Sector, Gender
Last updated:
apr 23, 2017
Indicators value changes by year
At the date of observation
Value
Absolute change
Change from the previous value
jan 1, 2007
8.947
+8.947
0.0%
jan 1, 2008
9.219
+0.272
3.04%
jan 1, 2009
7.116
-2.103
-22.81%
jan 1, 2010
5.377
-1.739
-24.44%
jan 1, 2014
6.804
+1.427
26.53%
Ranking of countries by current statistics by years