Download This statistics in other country:
Timeline:
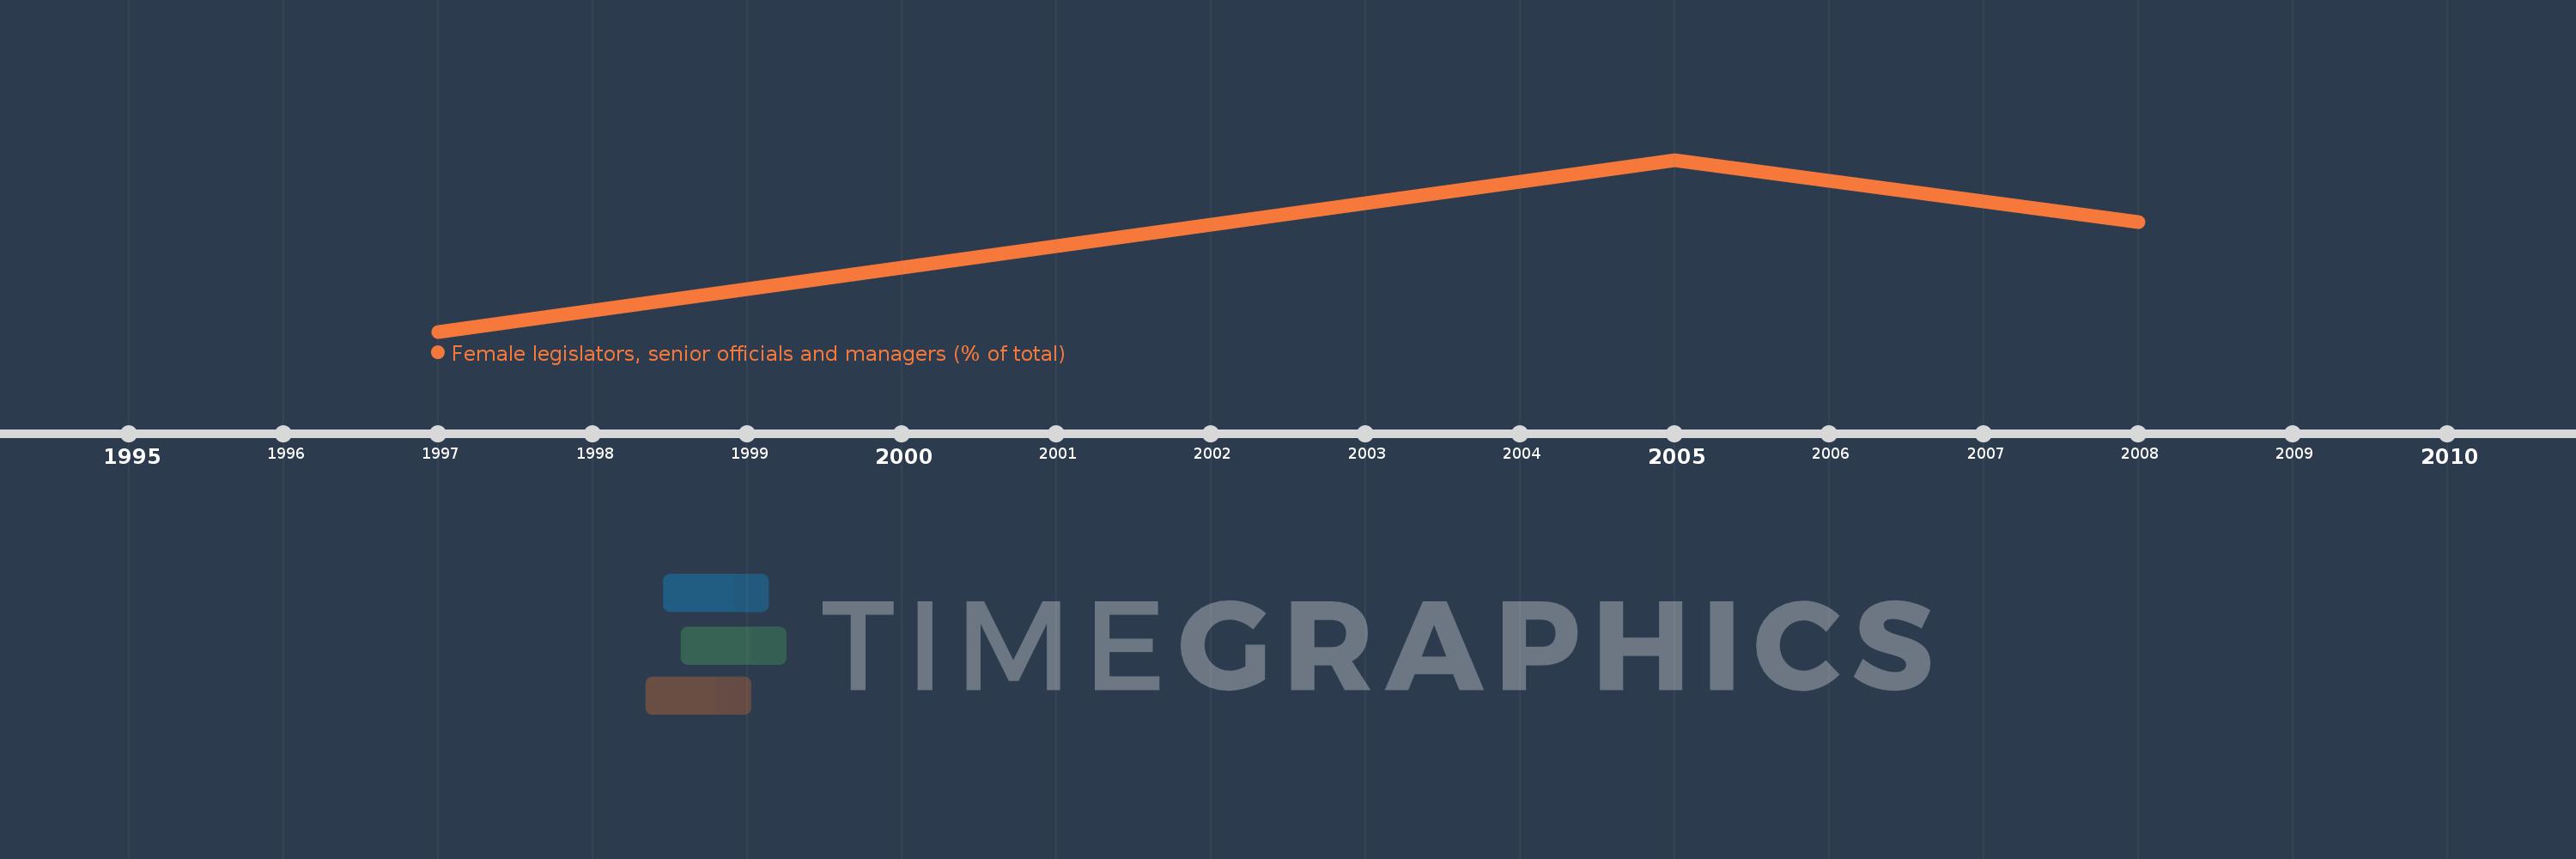
This timeline shows a graph from 1997 to 2008 of Fiji. No data until 1996. Number of actual observations by date: 3.
Source name:
World Development Indicators
Source organization:
ILO Key Indicators of the Labour Market (KILM).
Categories, topics:
Public Sector, Gender
Last updated:
apr 23, 2017
Indicators value changes by year
Minimum:
17.805
jan 1, 1997
Maximum:
27.164
jan 1, 2005
At the date of observation
Value
Absolute change
Change from the previous value
jan 1, 1997
17.805
+17.805
0.0%
jan 1, 2005
27.164
+9.36
52.57%
jan 1, 2008
23.766
-3.398
-12.51%
Ranking of countries by current statistics by years