Download This statistics in other country:
Timeline:
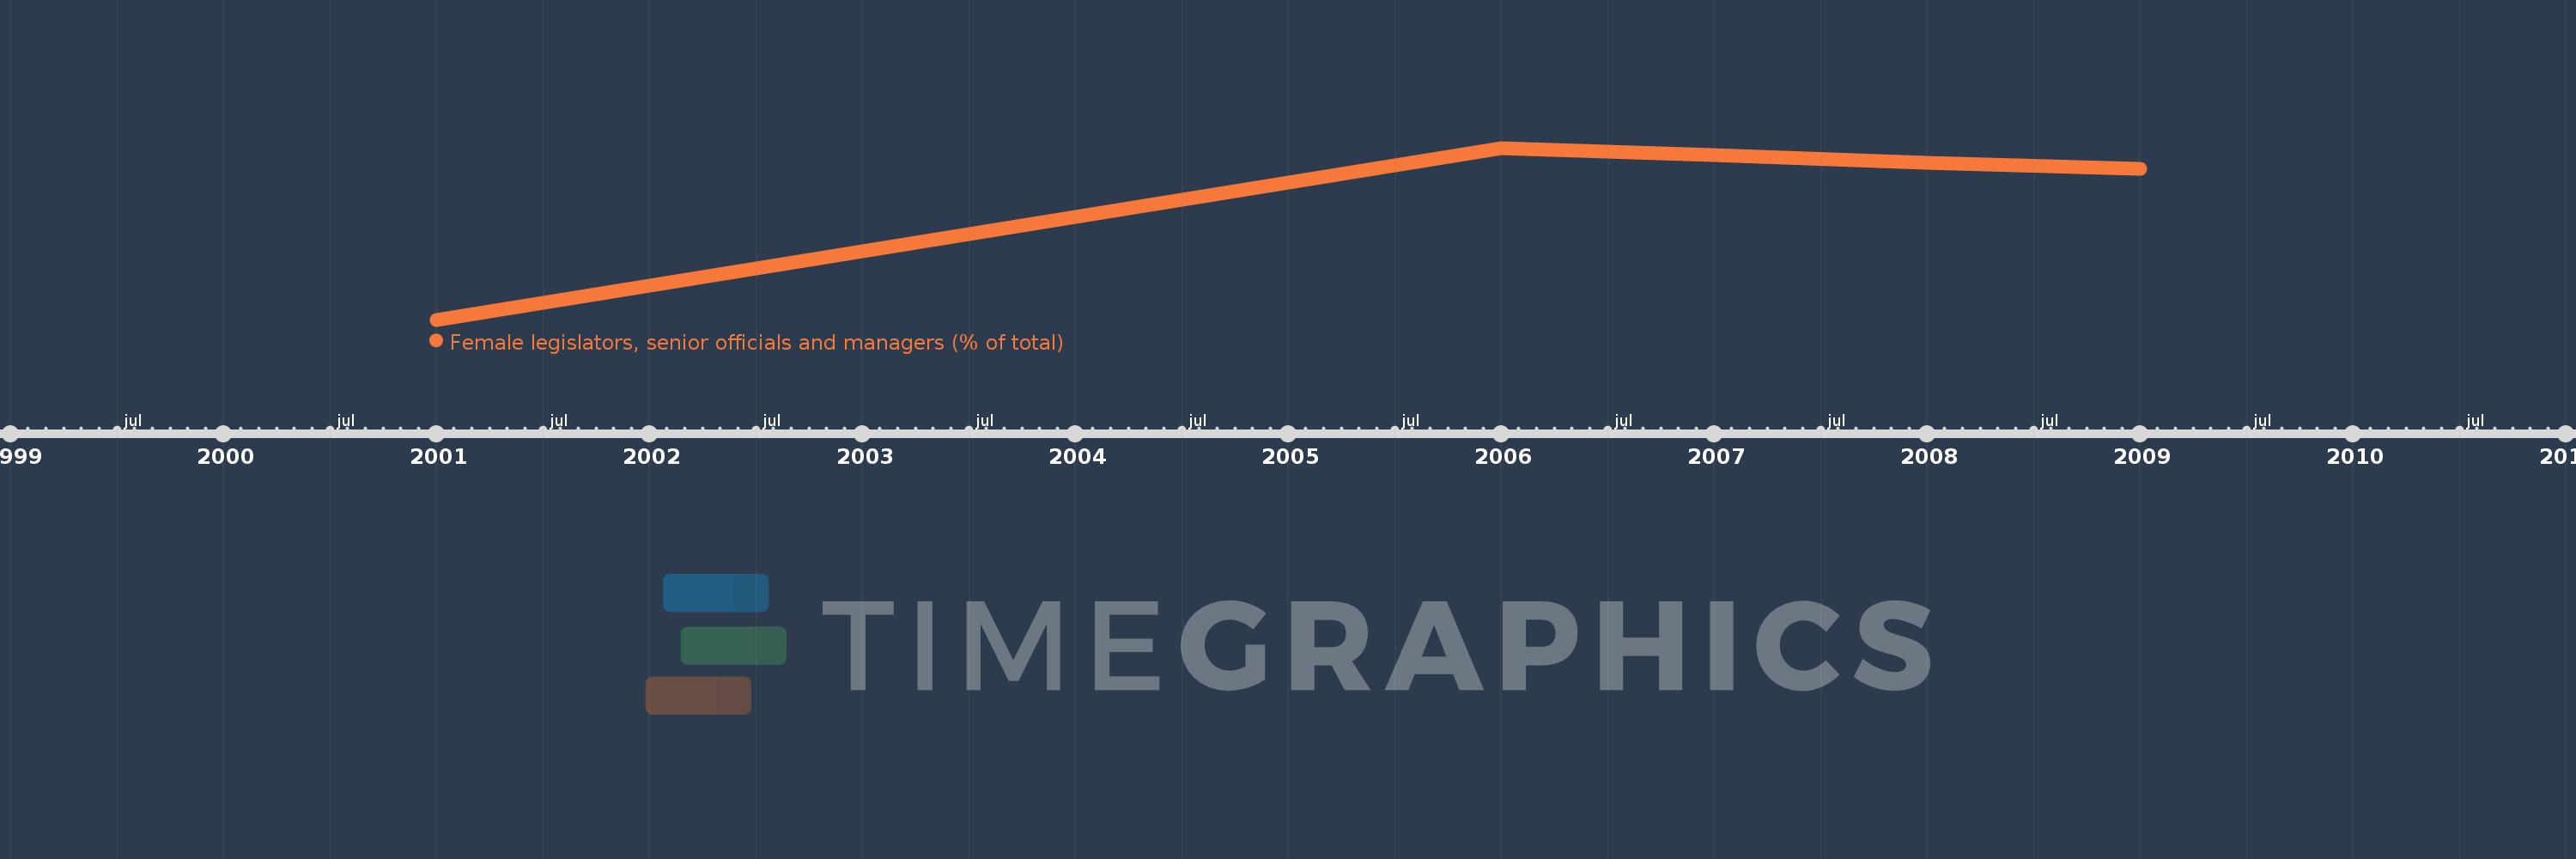
This timeline shows a graph from 2001 to 2009 of Mongolia. No data until 2000. Number of actual observations by date: 5.
Source name:
World Development Indicators
Source organization:
ILO Key Indicators of the Labour Market (KILM).
Categories, topics:
Public Sector, Gender
Last updated:
apr 23, 2017
Indicators value changes by year
Minimum:
30.208
jan 1, 2001
Maximum:
49.755
jan 1, 2006
At the date of observation
Value
Absolute change
Change from the previous value
jan 1, 2001
30.208
+30.208
0.0%
jan 1, 2006
49.755
+19.547
64.71%
jan 1, 2007
48.93
-0.825
-1.66%
jan 1, 2008
48.111
-0.818
-1.67%
jan 1, 2009
47.41
-0.701
-1.46%
Ranking of countries by current statistics by years