Download This statistics in other country:
Timeline:
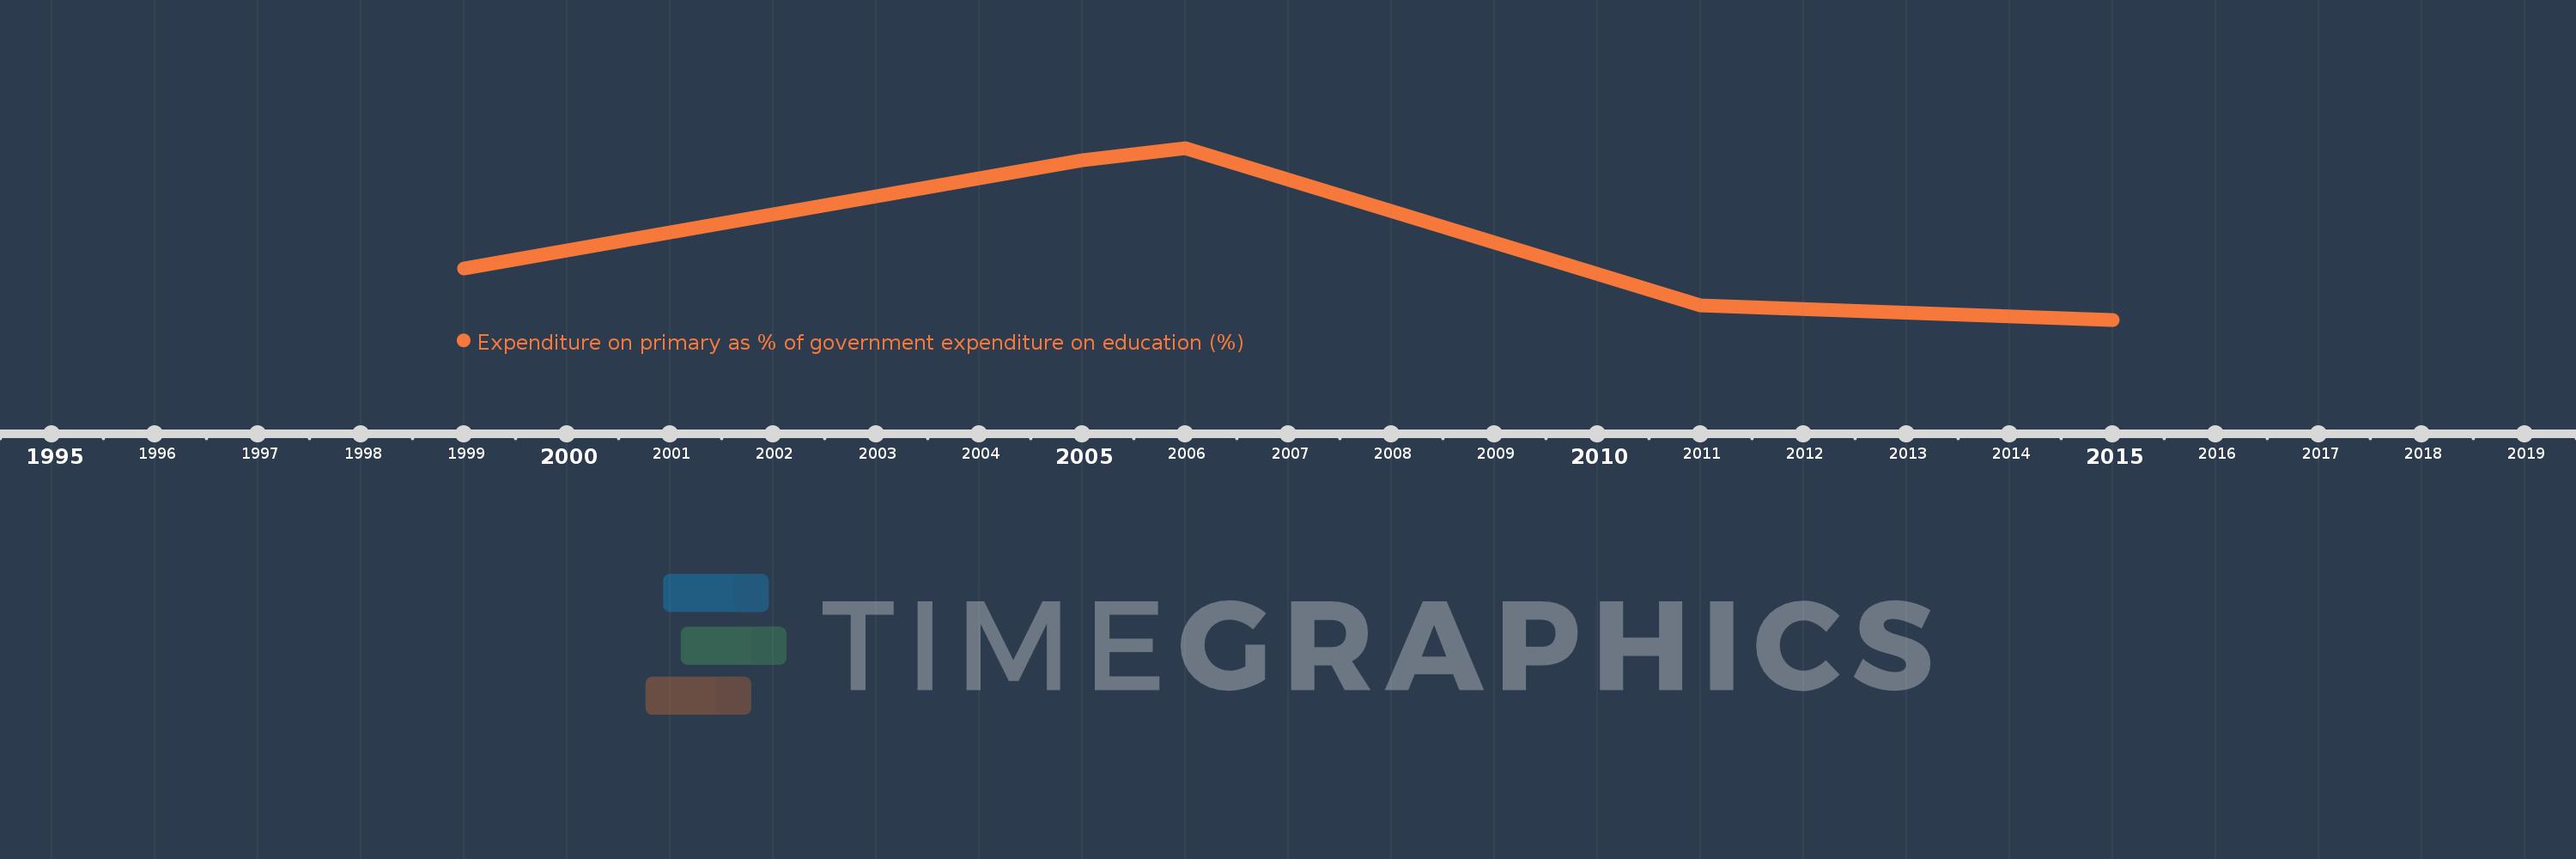
This timeline shows a graph from 1999 to 2015 of Bermuda. No data until 1998. Number of actual observations by date: 5.
Source name:
World Development Indicators
Source organization:
UNESCO Institute for Statistics
Categories, topics:
Education
Last updated:
apr 23, 2017
Indicators value changes by year
Minimum:
29.936
jan 1, 2015
Maximum:
40.747
jan 1, 2006
At the date of observation
Value
Absolute change
Change from the previous value
jan 1, 1999
33.145
+33.145
0.0%
jan 1, 2005
39.975
+6.83
20.61%
jan 1, 2006
40.747
+0.772
1.93%
jan 1, 2011
30.845
-9.903
-24.3%
jan 1, 2015
29.936
-0.908
-2.95%
Ranking of countries by current statistics by years