Download This statistics in other country:
Timeline:
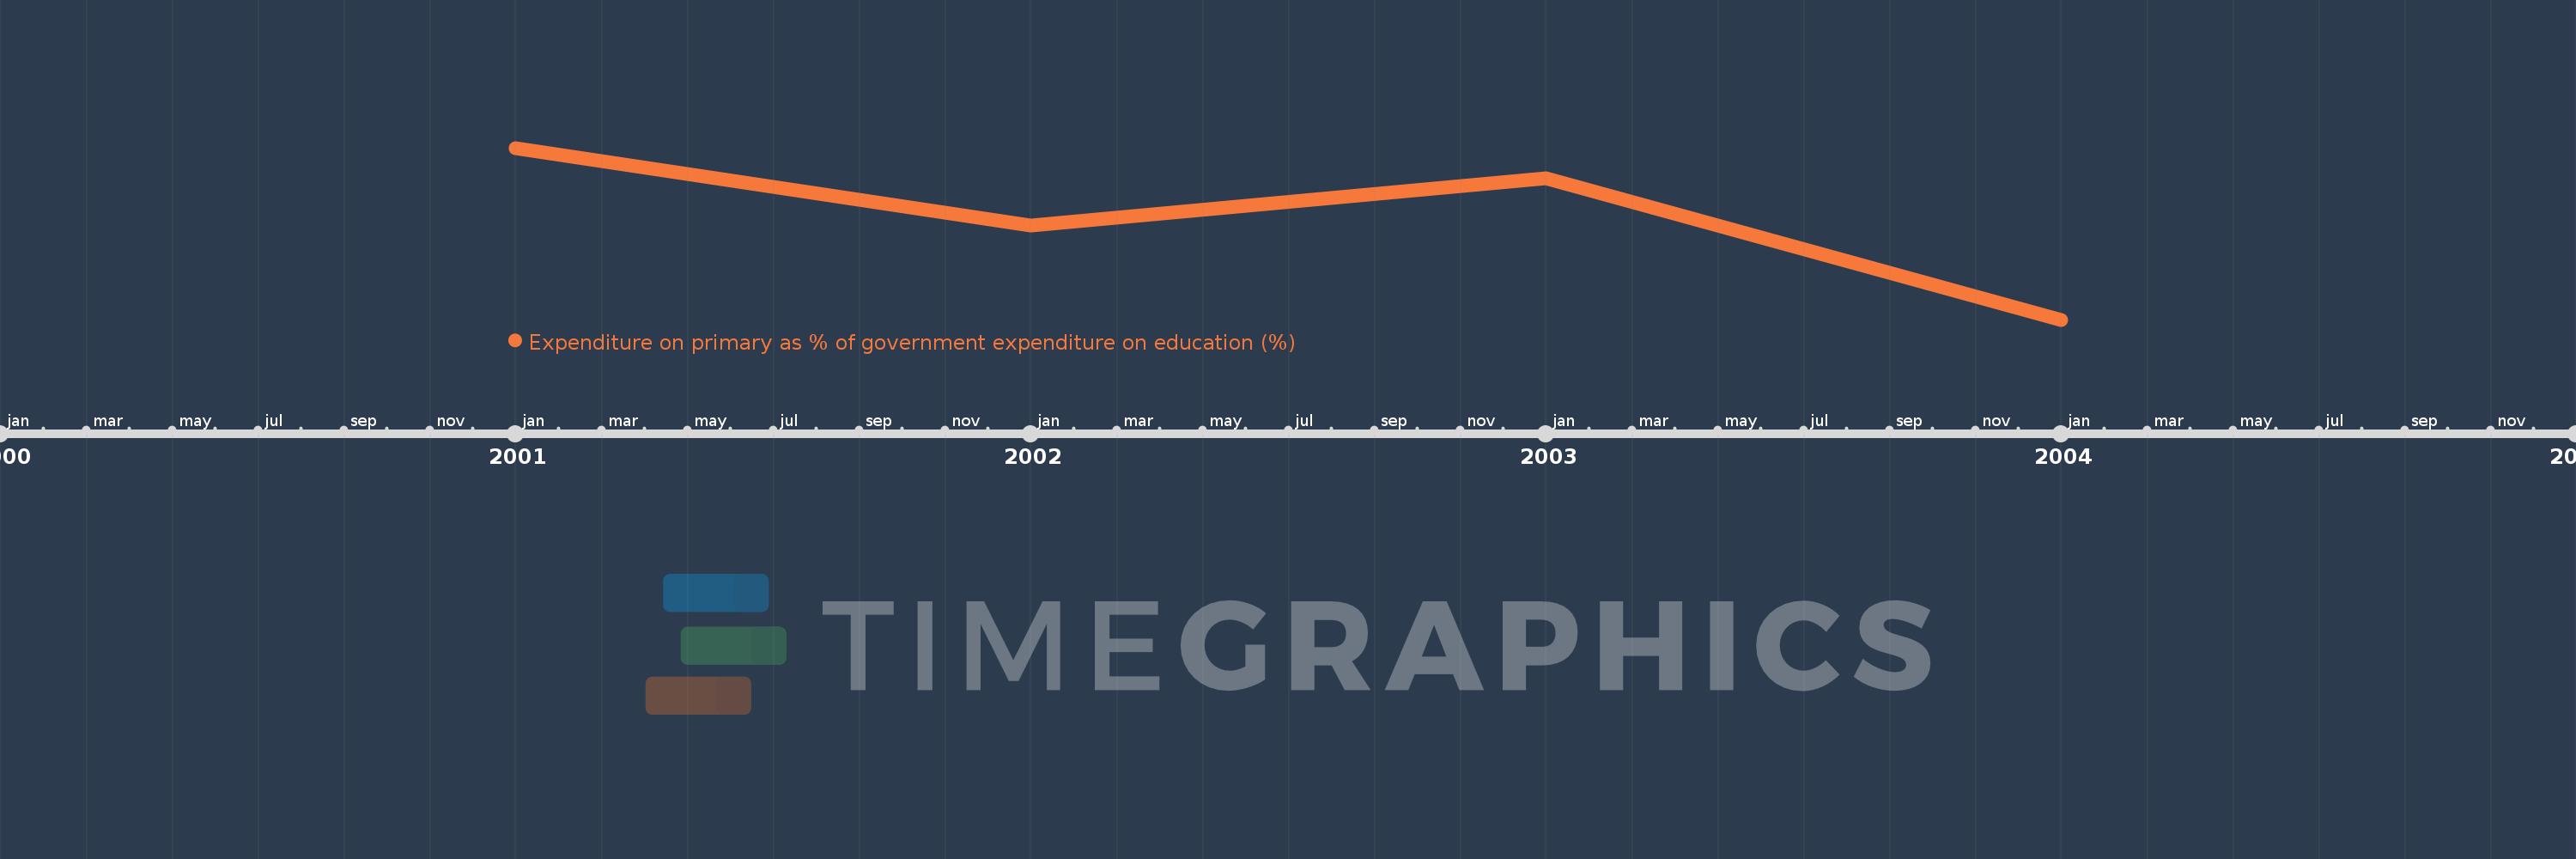
This timeline shows a graph from 2001 to 2004 of Trinidad and Tobago. No data until 2000. Number of actual observations by date: 4.
Source name:
World Development Indicators
Source organization:
UNESCO Institute for Statistics
Categories, topics:
Education
Last updated:
apr 23, 2017
Indicators value changes by year
Minimum:
39.182
jan 1, 2004
Maximum:
50.243
jan 1, 2001
At the date of observation
Value
Absolute change
Change from the previous value
jan 1, 2001
50.243
+50.243
0.0%
jan 1, 2002
45.262
-4.982
-9.91%
jan 1, 2003
48.274
+3.013
6.66%
jan 1, 2004
39.182
-9.092
-18.83%
Ranking of countries by current statistics by years