Download This statistics in other country:
Timeline:
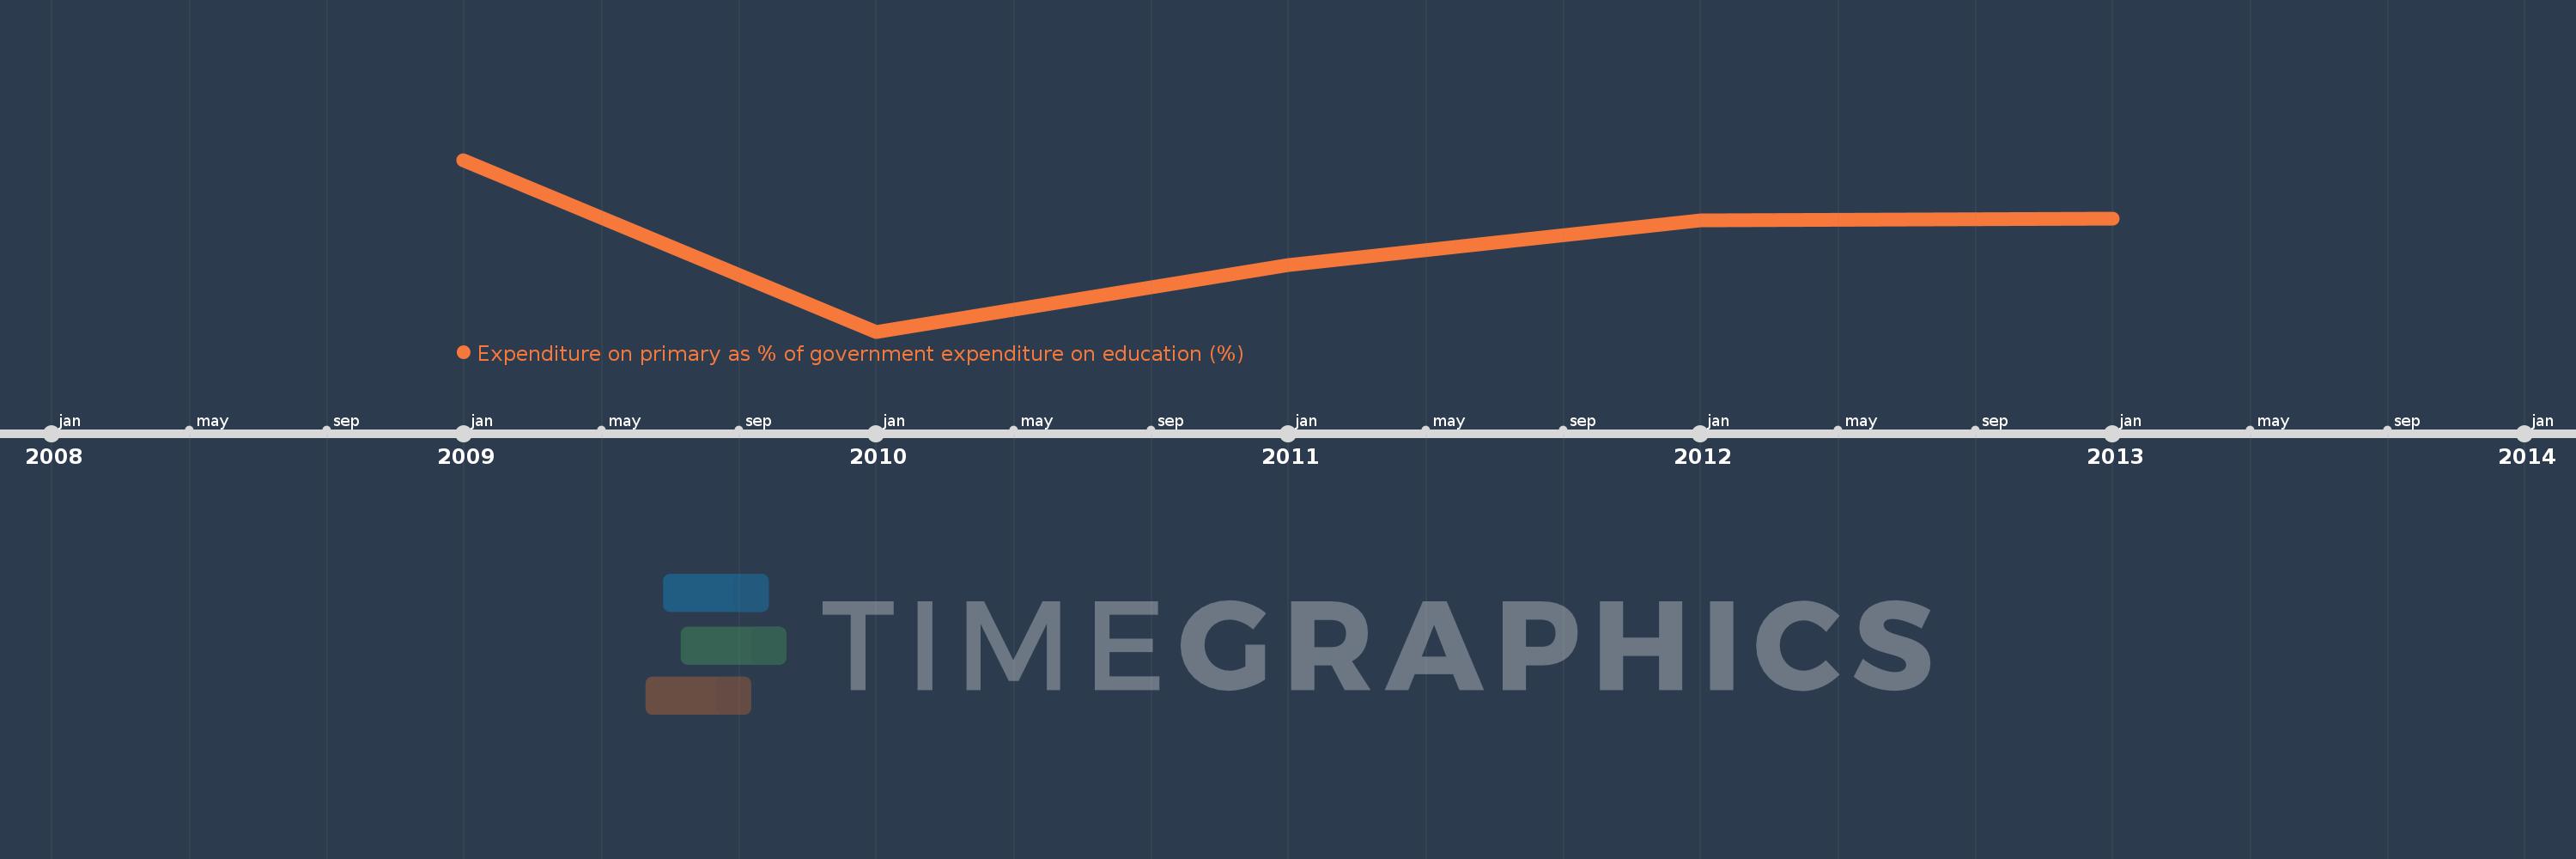
This timeline shows a graph from 2009 to 2013 of East Asia & Pacific. No data until 2008. Number of actual observations by date: 5.
Source name:
World Development Indicators
Source organization:
UNESCO Institute for Statistics
Categories, topics:
Education
Last updated:
apr 23, 2017
Indicators value changes by year
Minimum:
30.156
jan 1, 2010
Maximum:
35.196
jan 1, 2009
At the date of observation
Value
Absolute change
Change from the previous value
jan 1, 2009
35.196
+35.196
0.0%
jan 1, 2010
30.156
-5.04
-14.32%
jan 1, 2011
32.107
+1.951
6.47%
jan 1, 2012
33.423
+1.316
4.1%
jan 1, 2013
33.481
+0.058
0.17%
Ranking of countries by current statistics by years