Download This statistics in other country:
Timeline:
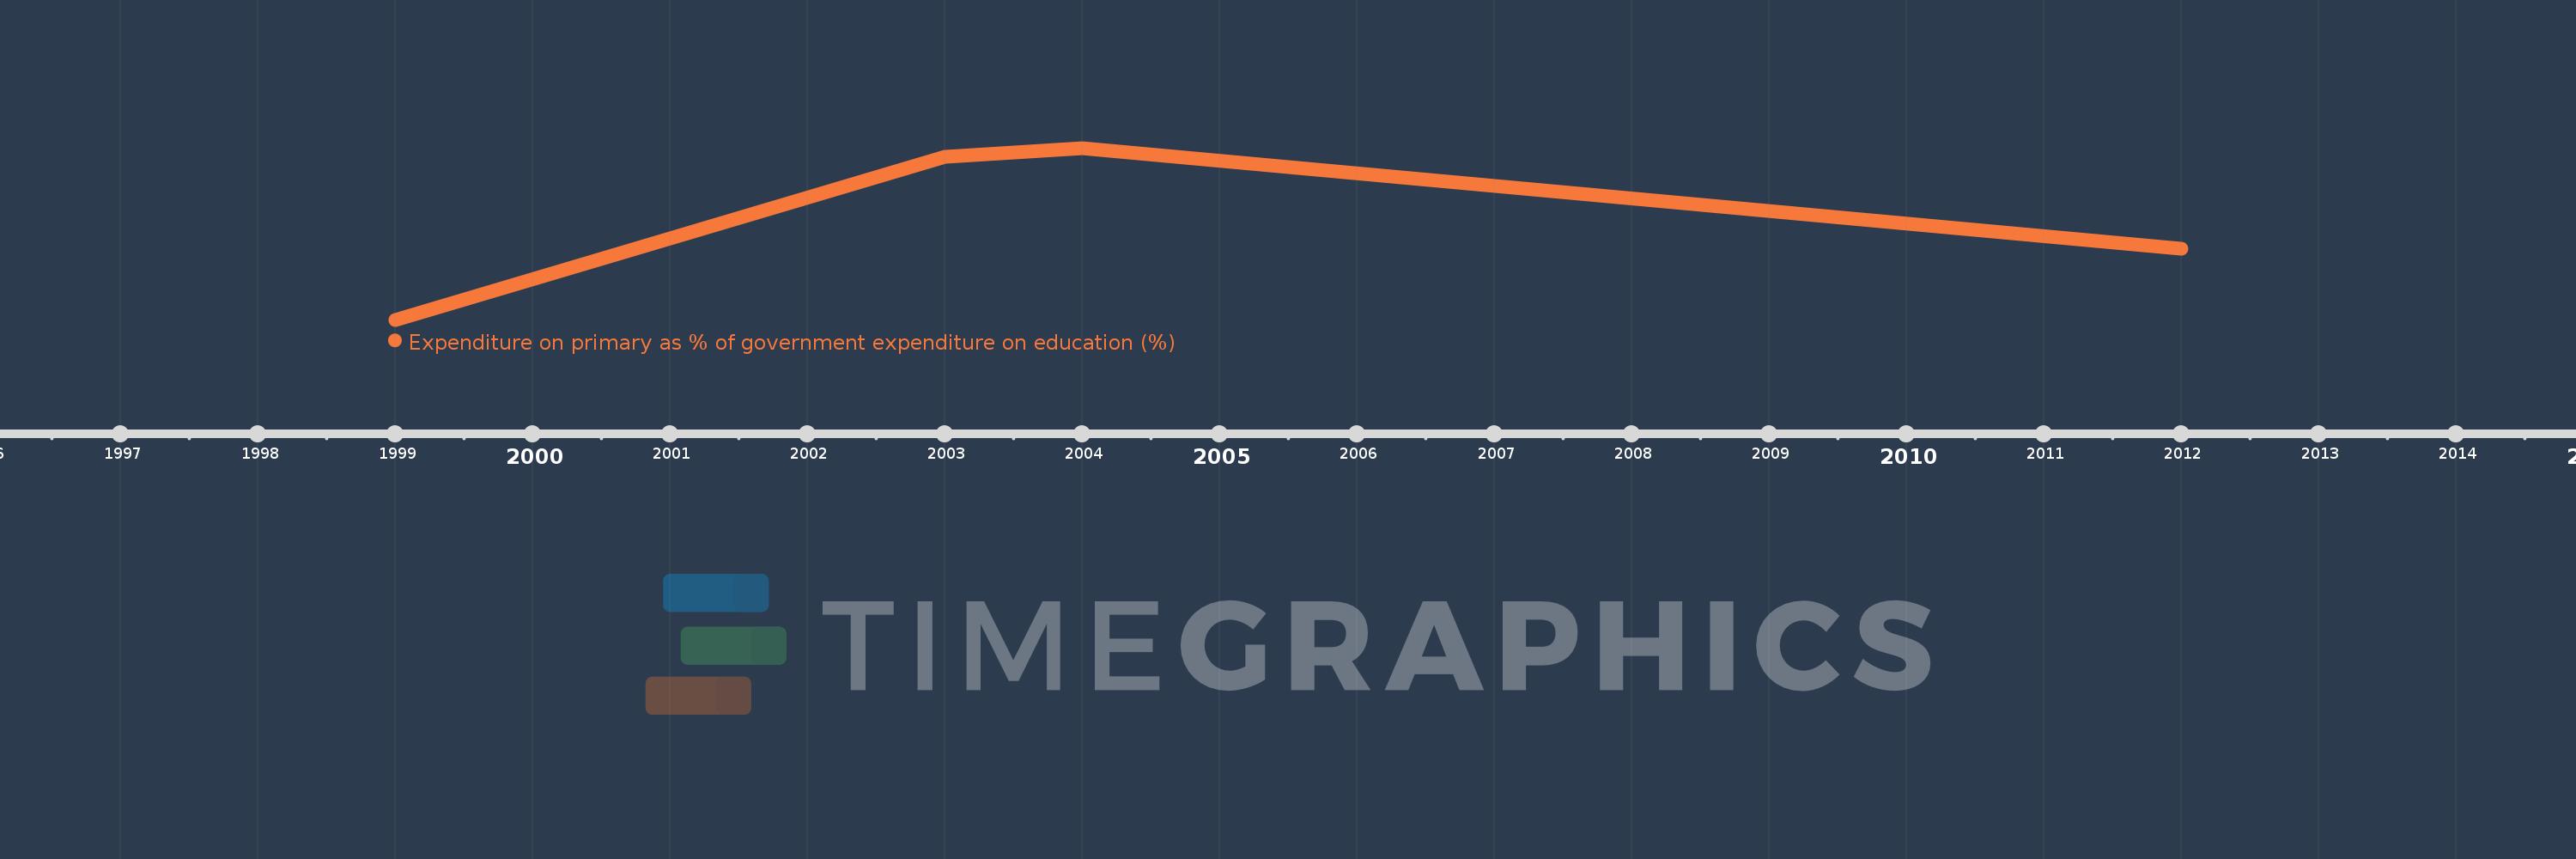
This timeline shows a graph from 1999 to 2012 of Seychelles. No data until 1998. Number of actual observations by date: 4.
Source name:
World Development Indicators
Source organization:
UNESCO Institute for Statistics
Categories, topics:
Education
Last updated:
apr 23, 2017
Indicators value changes by year
Minimum:
17.748
jan 1, 1999
Maximum:
32.821
jan 1, 2004
At the date of observation
Value
Absolute change
Change from the previous value
jan 1, 1999
17.748
+17.748
0.0%
jan 1, 2003
32.012
+14.265
80.37%
jan 1, 2004
32.821
+0.809
2.53%
jan 1, 2012
23.96
-8.861
-27.0%
Ranking of countries by current statistics by years