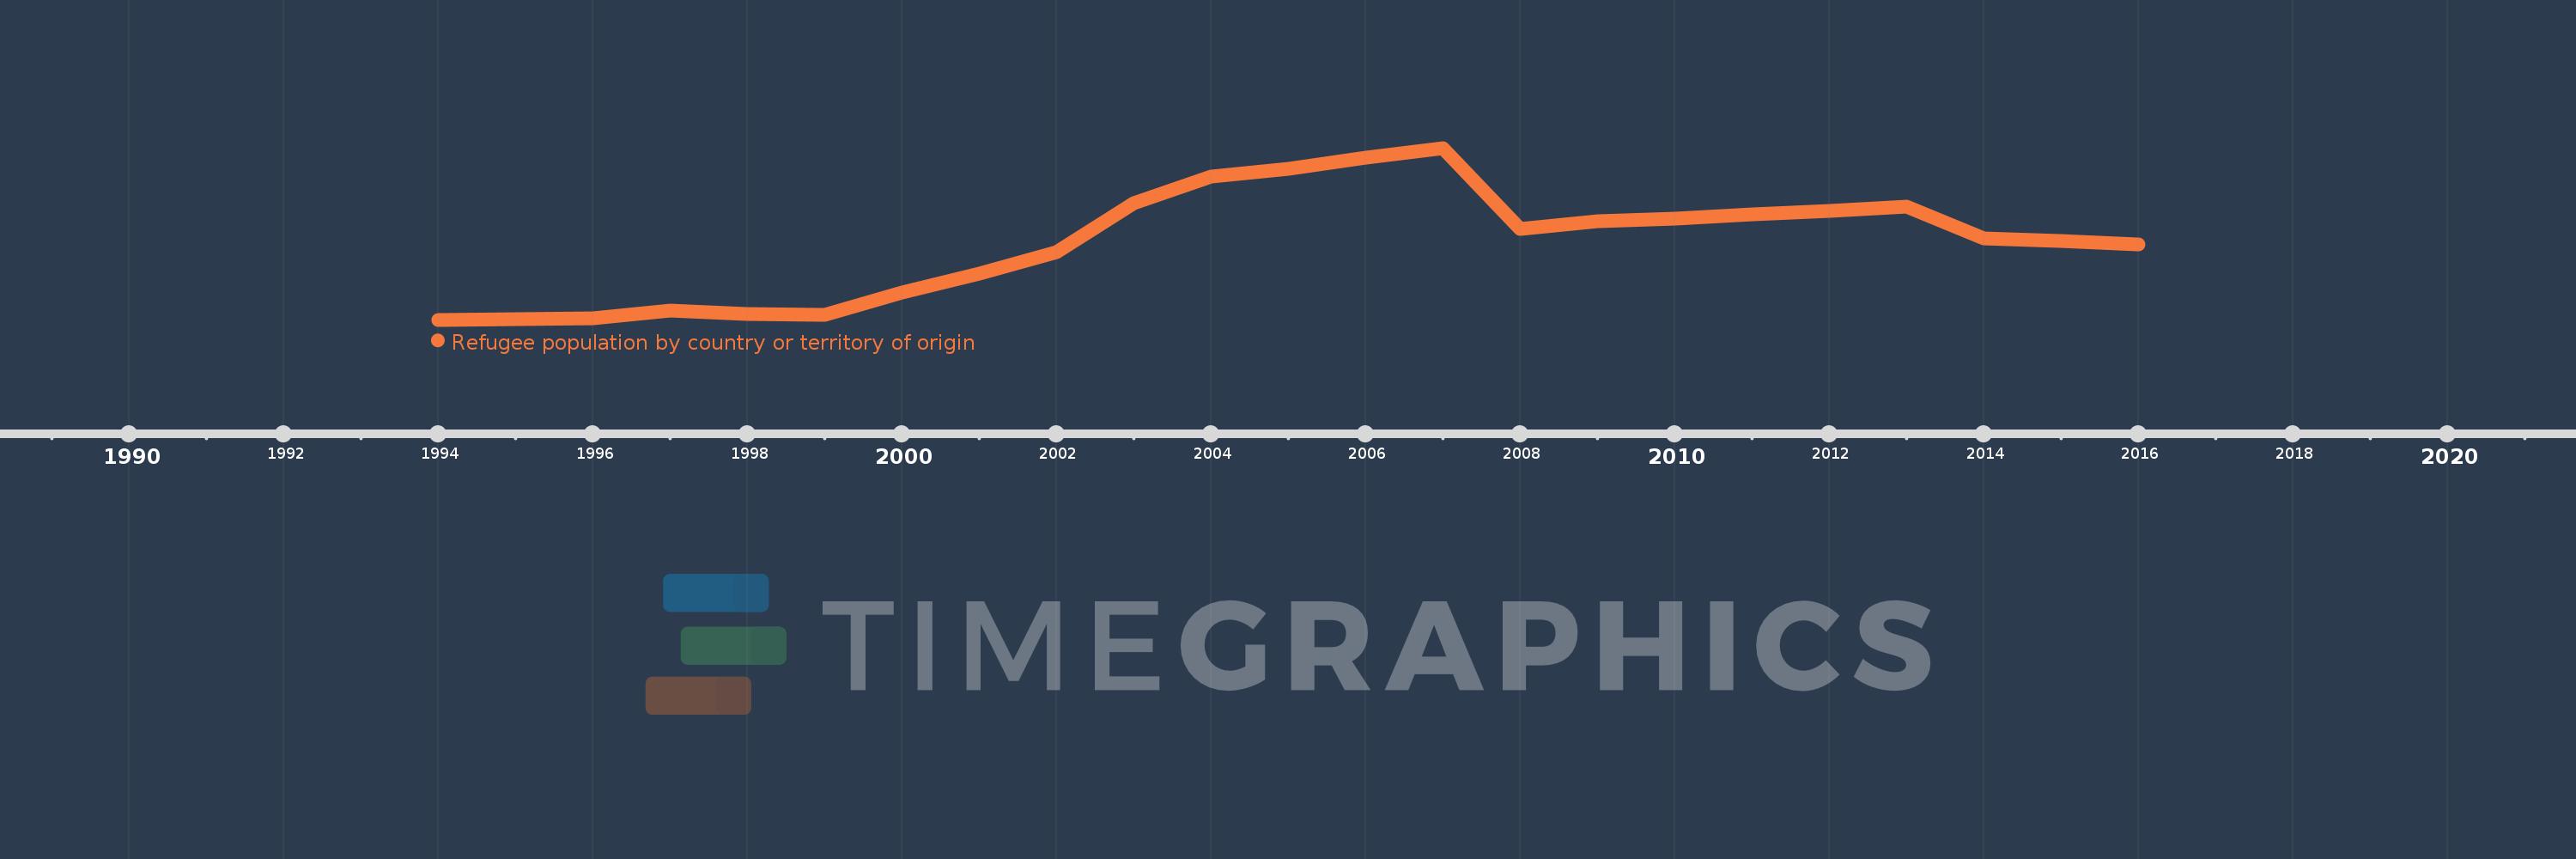
This timeline shows a graph from 1994 to 2016 of Belarus. No data until 1993. Number of actual observations by date: 23.
Source name:
World Development Indicators
Source organization:
United Nations High Commissioner for Refugees (UNHCR), Statistical Yearbook and data files, complemented by statistics on Palestinian refugees under the mandate of the UNRWA as published on its website. Data from UNHCR are available online at: www.unhcr.org/statistics/populationdatabase.
Categories, topics:
Health, Social Development
Last updated:
apr 23, 2017
Indicators value changes by year
Meaning:
4.182K
Minimum:
2.0
jan 1, 1994
Maximum:
9.371K
jan 1, 2007
At the date of observation
Value
Absolute change
Change from the previous value
jan 1, 1994
2.0
+2.0
0.0%
jan 1, 1995
37.0
+35.0
1.75K%
jan 1, 1996
84.0
+47.0
127.03%
jan 1, 1997
501.0
+417.0
496.43%
jan 1, 1998
303.0
-198.0
-39.52%
jan 1, 1999
290.0
-13.0
-4.29%
jan 1, 2000
1.507K
+1.217K
419.66%
jan 1, 2001
2.519K
+1.012K
67.15%
jan 1, 2002
3.696K
+1.177K
46.72%
jan 1, 2003
6.364K
+2.668K
72.19%
jan 1, 2004
7.815K
+1.451K
22.8%
jan 1, 2005
8.244K
+429.0
5.49%
jan 1, 2006
8.857K
+613.0
7.44%
jan 1, 2007
9.371K
+514.0
5.8%
jan 1, 2008
4.97K
-4.401K
-46.96%
jan 1, 2009
5.384K
+414.0
8.33%
jan 1, 2010
5.525K
+141.0
2.62%
jan 1, 2011
5.743K
+218.0
3.95%
jan 1, 2012
5.925K
+182.0
3.17%
jan 1, 2013
6.191K
+266.0
4.49%
jan 1, 2014
4.444K
-1.747K
-28.22%
jan 1, 2015
4.3K
-144.0
-3.24%
jan 1, 2016
4.124K
-176.0
-4.09%
Ranking of countries by current statistics by years