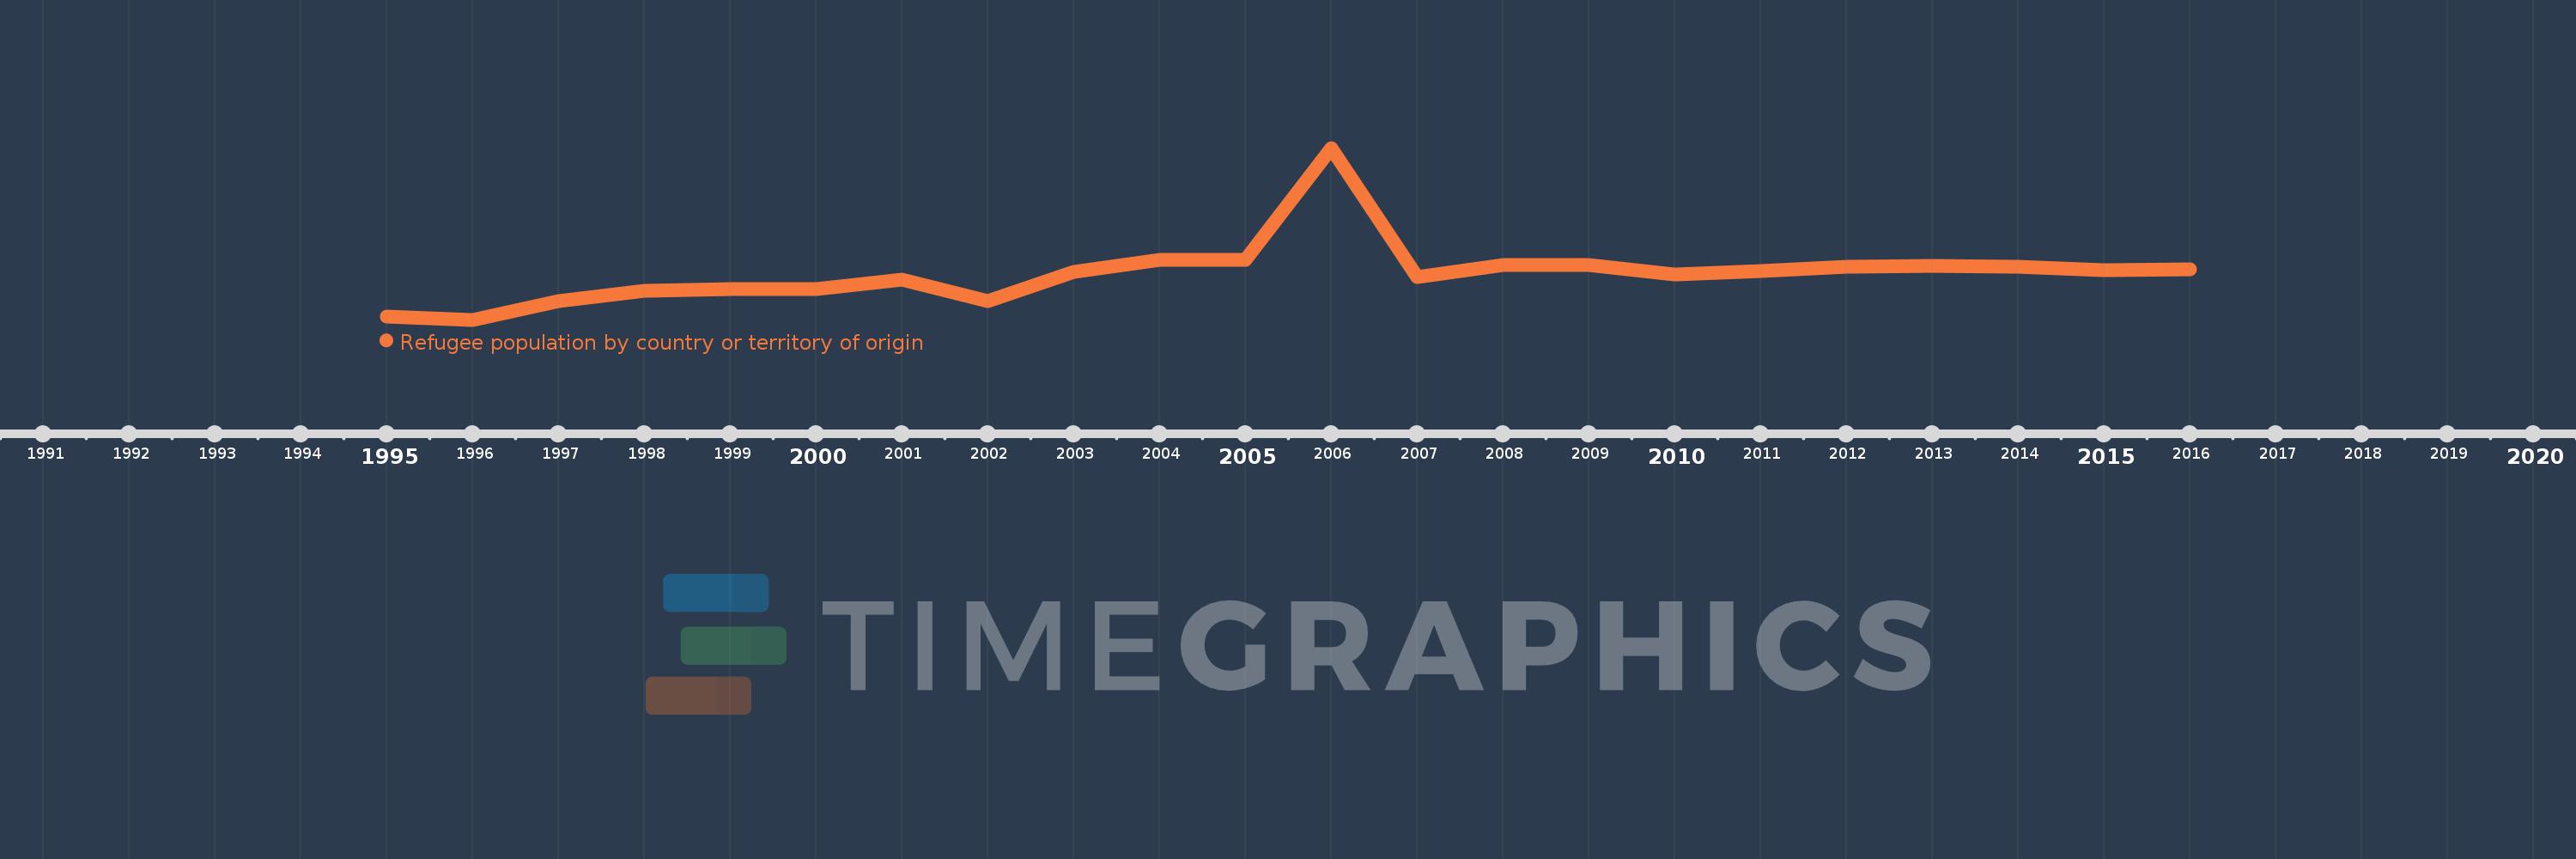
This timeline shows a graph from 1995 to 2016 of France. No data until 1994. Number of actual observations by date: 22.
Source name:
World Development Indicators
Source organization:
United Nations High Commissioner for Refugees (UNHCR), Statistical Yearbook and data files, complemented by statistics on Palestinian refugees under the mandate of the UNRWA as published on its website. Data from UNHCR are available online at: www.unhcr.org/statistics/populationdatabase.
Categories, topics:
Health, Social Development
Last updated:
apr 23, 2017
Indicators value changes by year
Meaning:
87.818
Minimum:
15.0
jan 1, 1996
Maximum:
286.0
jan 1, 2006
At the date of observation
Value
Absolute change
Change from the previous value
jan 1, 1995
20.0
+20.0
0.0%
jan 1, 1996
15.0
-5.0
-25.0%
jan 1, 1997
44.0
+29.0
193.33%
jan 1, 1998
61.0
+17.0
38.64%
jan 1, 1999
64.0
+3.0
4.92%
jan 1, 2000
63.0
-1.0
-1.56%
jan 1, 2001
78.0
+15.0
23.81%
jan 1, 2002
44.0
-34.0
-43.59%
jan 1, 2003
90.0
+46.0
104.55%
jan 1, 2004
110.0
+20.0
22.22%
jan 1, 2005
110.0
0.0
0.0%
jan 1, 2006
286.0
+176.0
160.0%
jan 1, 2007
82.0
-204.0
-71.33%
jan 1, 2008
101.0
+19.0
23.17%
jan 1, 2009
101.0
0.0
0.0%
jan 1, 2010
87.0
-14.0
-13.86%
jan 1, 2011
92.0
+5.0
5.75%
jan 1, 2012
99.0
+7.0
7.61%
jan 1, 2013
100.0
+1.0
1.01%
jan 1, 2014
98.0
-2.0
-2.0%
jan 1, 2015
93.0
-5.0
-5.1%
jan 1, 2016
94.0
+1.0
1.08%
Ranking of countries by current statistics by years