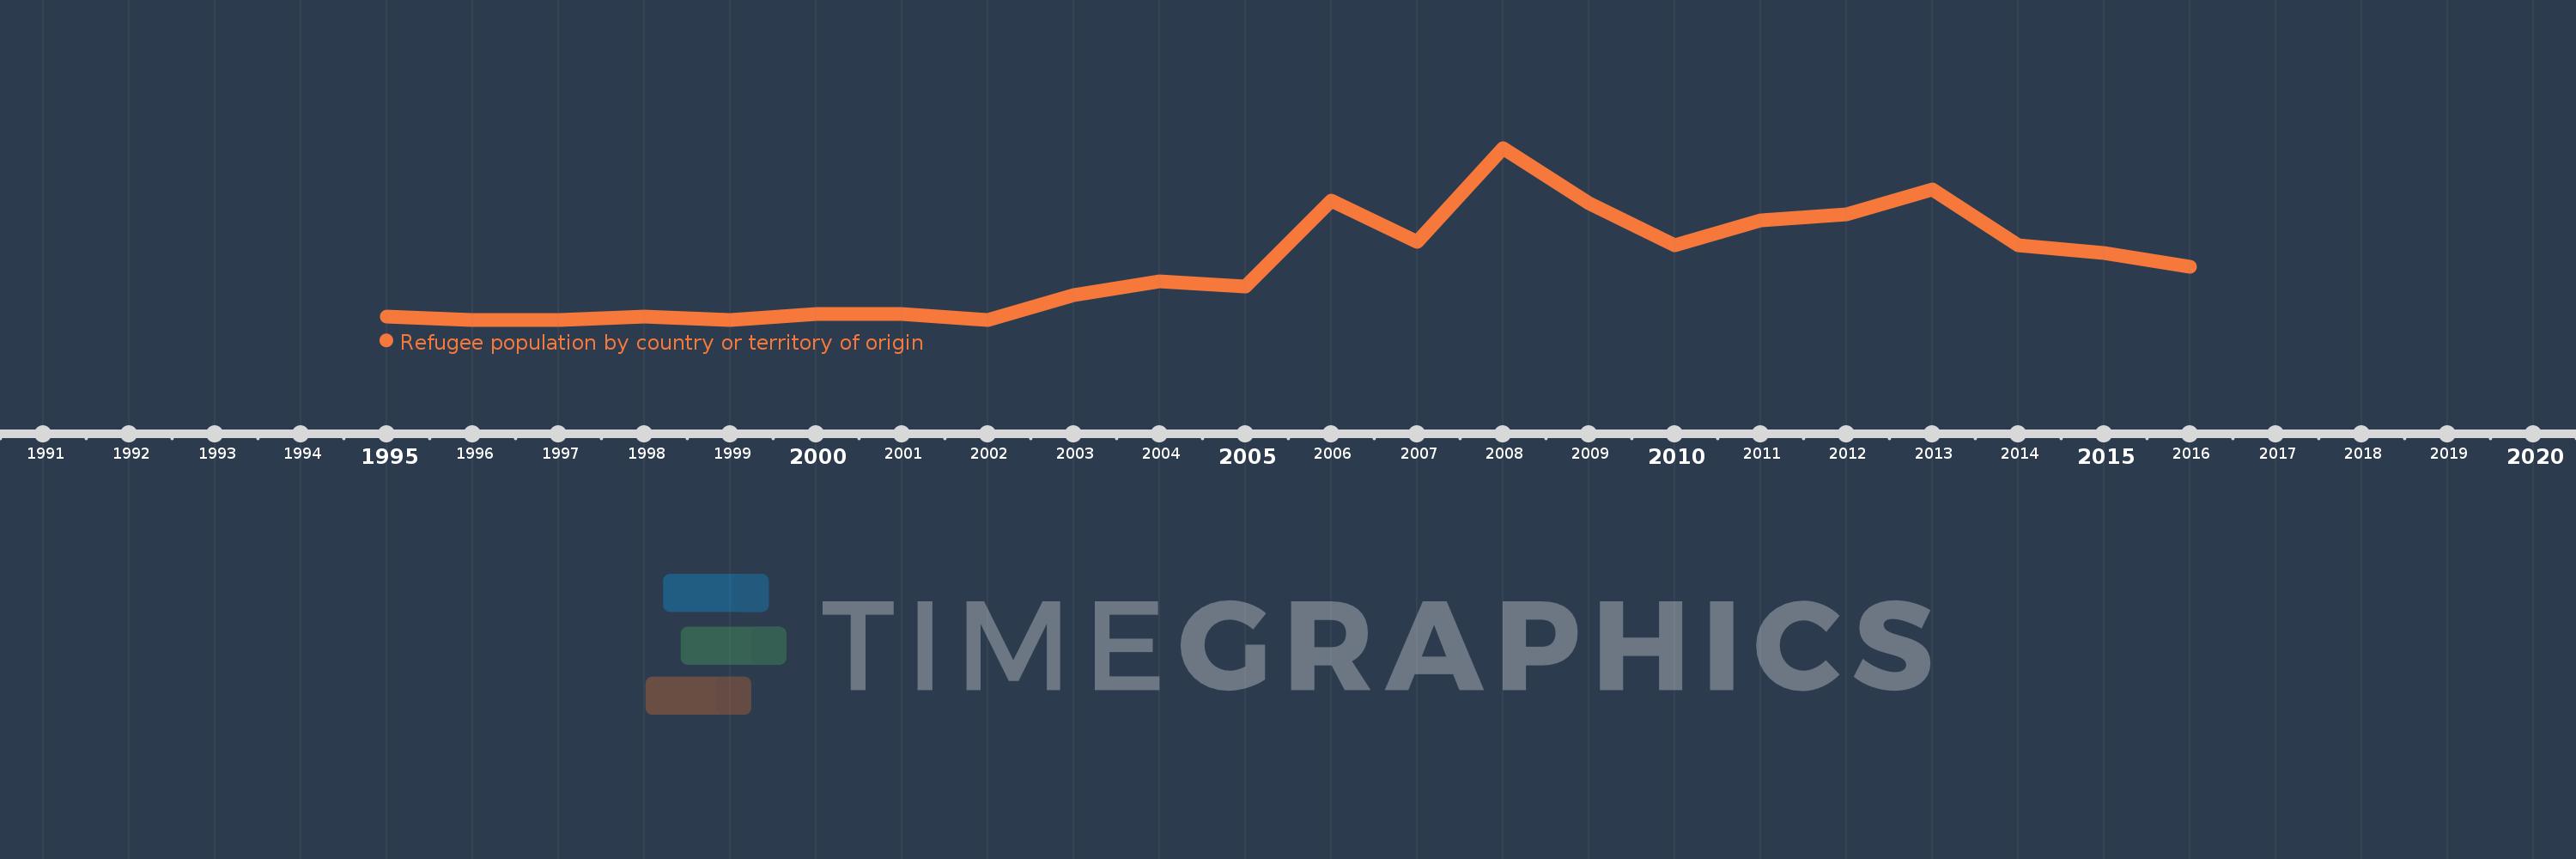
This timeline shows a graph from 1995 to 2016 of Australia. No data until 1994. Number of actual observations by date: 22.
Source name:
World Development Indicators
Source organization:
United Nations High Commissioner for Refugees (UNHCR), Statistical Yearbook and data files, complemented by statistics on Palestinian refugees under the mandate of the UNRWA as published on its website. Data from UNHCR are available online at: www.unhcr.org/statistics/populationdatabase.
Categories, topics:
Health, Social Development
Last updated:
apr 23, 2017
Indicators value changes by year
Meaning:
20.727
Minimum:
1.0
jan 1, 1996
Maximum:
63.0
jan 1, 2008
At the date of observation
Value
Absolute change
Change from the previous value
jan 1, 1995
2.0
+2.0
0.0%
jan 1, 1996
1.0
-1.0
-50.0%
jan 1, 1997
1.0
0.0
0.0%
jan 1, 1998
2.0
+1.0
100.0%
jan 1, 1999
1.0
-1.0
-50.0%
jan 1, 2000
3.0
+2.0
200.0%
jan 1, 2001
3.0
0.0
0.0%
jan 1, 2002
1.0
-2.0
-66.67%
jan 1, 2003
10.0
+9.0
900.0%
jan 1, 2004
15.0
+5.0
50.0%
jan 1, 2005
13.0
-2.0
-13.33%
jan 1, 2006
44.0
+31.0
238.46%
jan 1, 2007
29.0
-15.0
-34.09%
jan 1, 2008
63.0
+34.0
117.24%
jan 1, 2009
43.0
-20.0
-31.75%
jan 1, 2010
28.0
-15.0
-34.88%
jan 1, 2011
37.0
+9.0
32.14%
jan 1, 2012
39.0
+2.0
5.41%
jan 1, 2013
48.0
+9.0
23.08%
jan 1, 2014
28.0
-20.0
-41.67%
jan 1, 2015
25.0
-3.0
-10.71%
jan 1, 2016
20.0
-5.0
-20.0%
Ranking of countries by current statistics by years