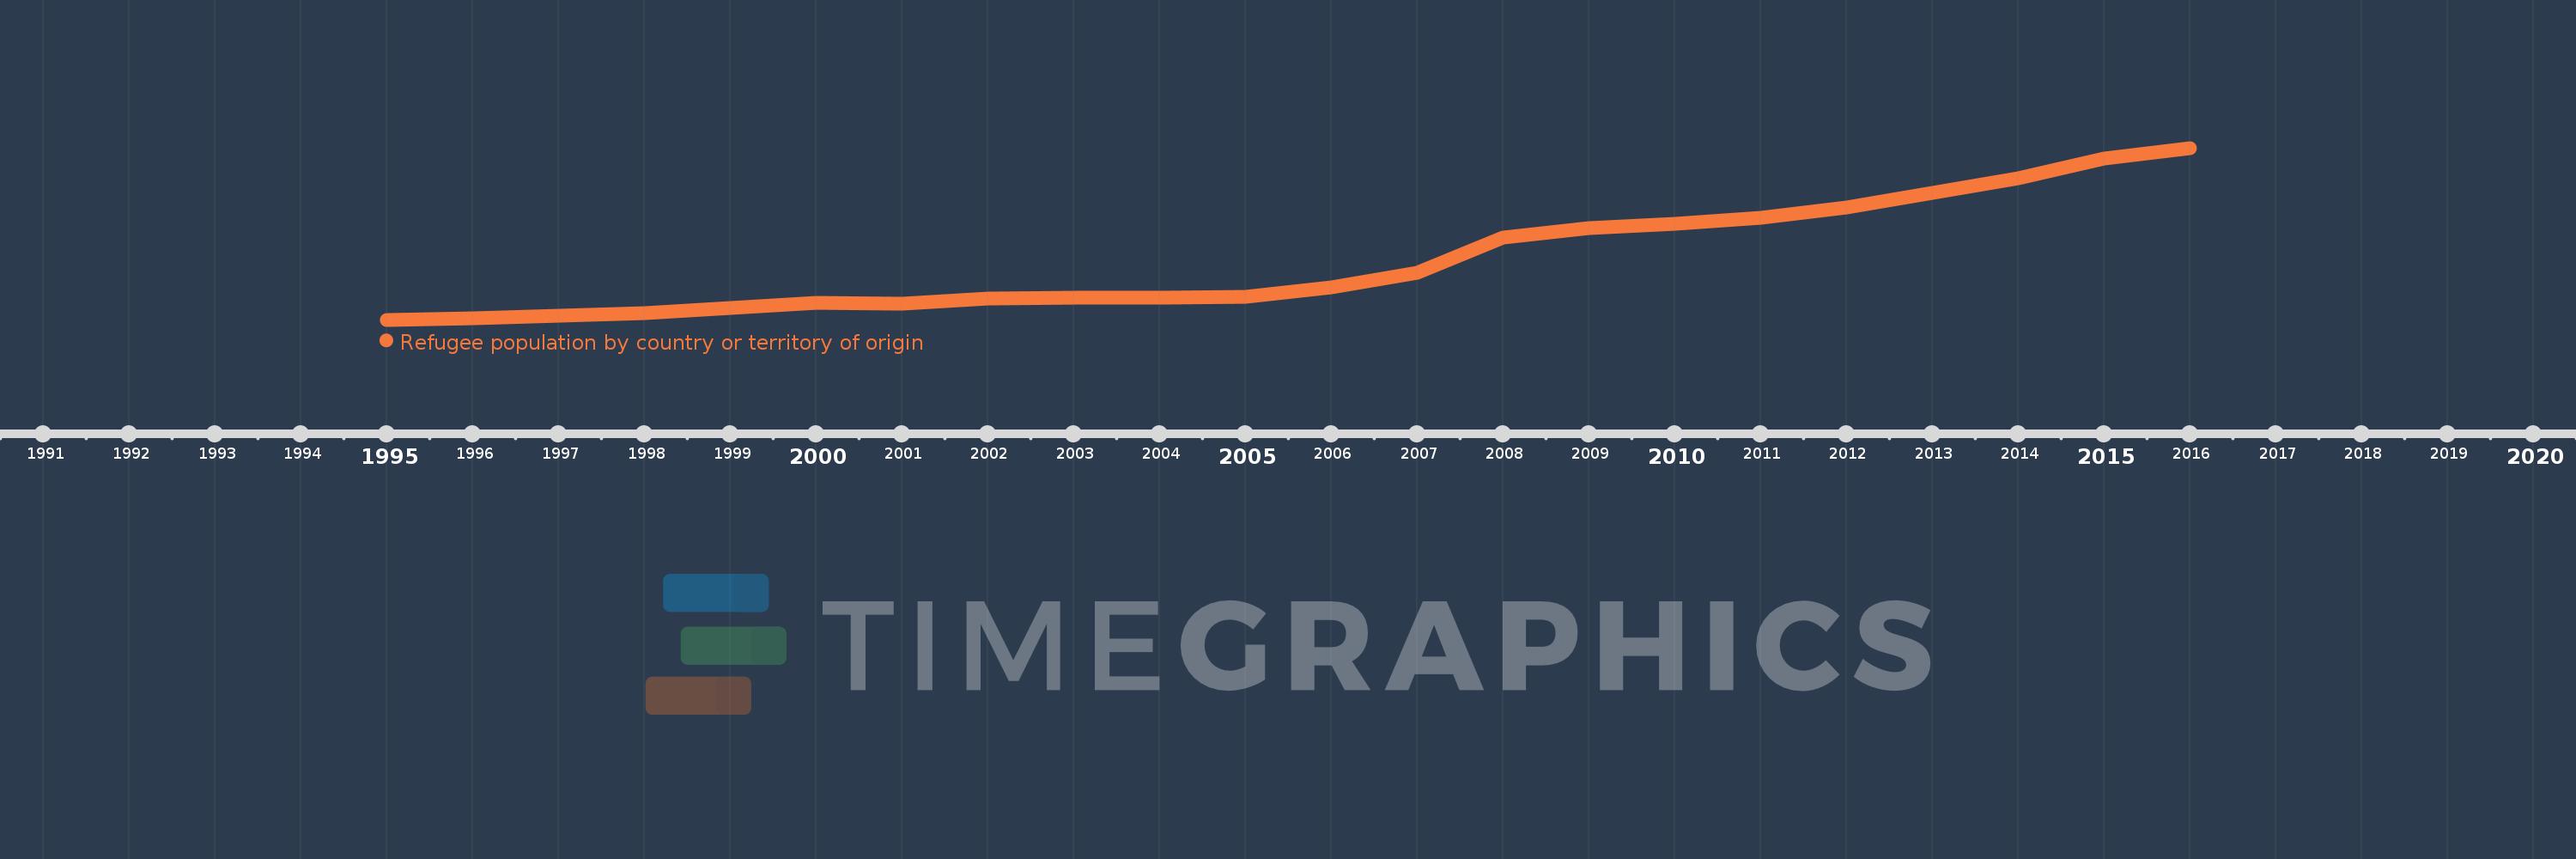
This timeline shows a graph from 1995 to 2016 of Mexico. No data until 1994. Number of actual observations by date: 22.
Source name:
World Development Indicators
Source organization:
United Nations High Commissioner for Refugees (UNHCR), Statistical Yearbook and data files, complemented by statistics on Palestinian refugees under the mandate of the UNRWA as published on its website. Data from UNHCR are available online at: www.unhcr.org/statistics/populationdatabase.
Categories, topics:
Health, Social Development
Last updated:
apr 23, 2017
Indicators value changes by year
Meaning:
4.092K
Minimum:
248.0
jan 1, 1995
Maximum:
11.333K
jan 1, 2016
At the date of observation
Value
Absolute change
Change from the previous value
jan 1, 1995
248.0
+248.0
0.0%
jan 1, 1996
361.0
+113.0
45.56%
jan 1, 1997
520.0
+159.0
44.04%
jan 1, 1998
665.0
+145.0
27.88%
jan 1, 1999
1.016K
+351.0
52.78%
jan 1, 2000
1.359K
+343.0
33.76%
jan 1, 2001
1.291K
-68.0
-5.0%
jan 1, 2002
1.594K
+303.0
23.47%
jan 1, 2003
1.67K
+76.0
4.77%
jan 1, 2004
1.652K
-18.0
-1.08%
jan 1, 2005
1.744K
+92.0
5.57%
jan 1, 2006
2.313K
+569.0
32.63%
jan 1, 2007
3.304K
+991.0
42.84%
jan 1, 2008
5.572K
+2.268K
68.64%
jan 1, 2009
6.162K
+590.0
10.59%
jan 1, 2010
6.435K
+273.0
4.43%
jan 1, 2011
6.816K
+381.0
5.92%
jan 1, 2012
7.472K
+656.0
9.62%
jan 1, 2013
8.435K
+963.0
12.89%
jan 1, 2014
9.396K
+961.0
11.39%
jan 1, 2015
10.666K
+1.27K
13.52%
jan 1, 2016
11.333K
+667.0
6.25%
Ranking of countries by current statistics by years