33
/
AIzaSyB4mHJ5NPEv-XzF7P6NDYXjlkCWaeKw5bc
November 30, 2025
76600
Bahamas, The
BHS
true
2
1
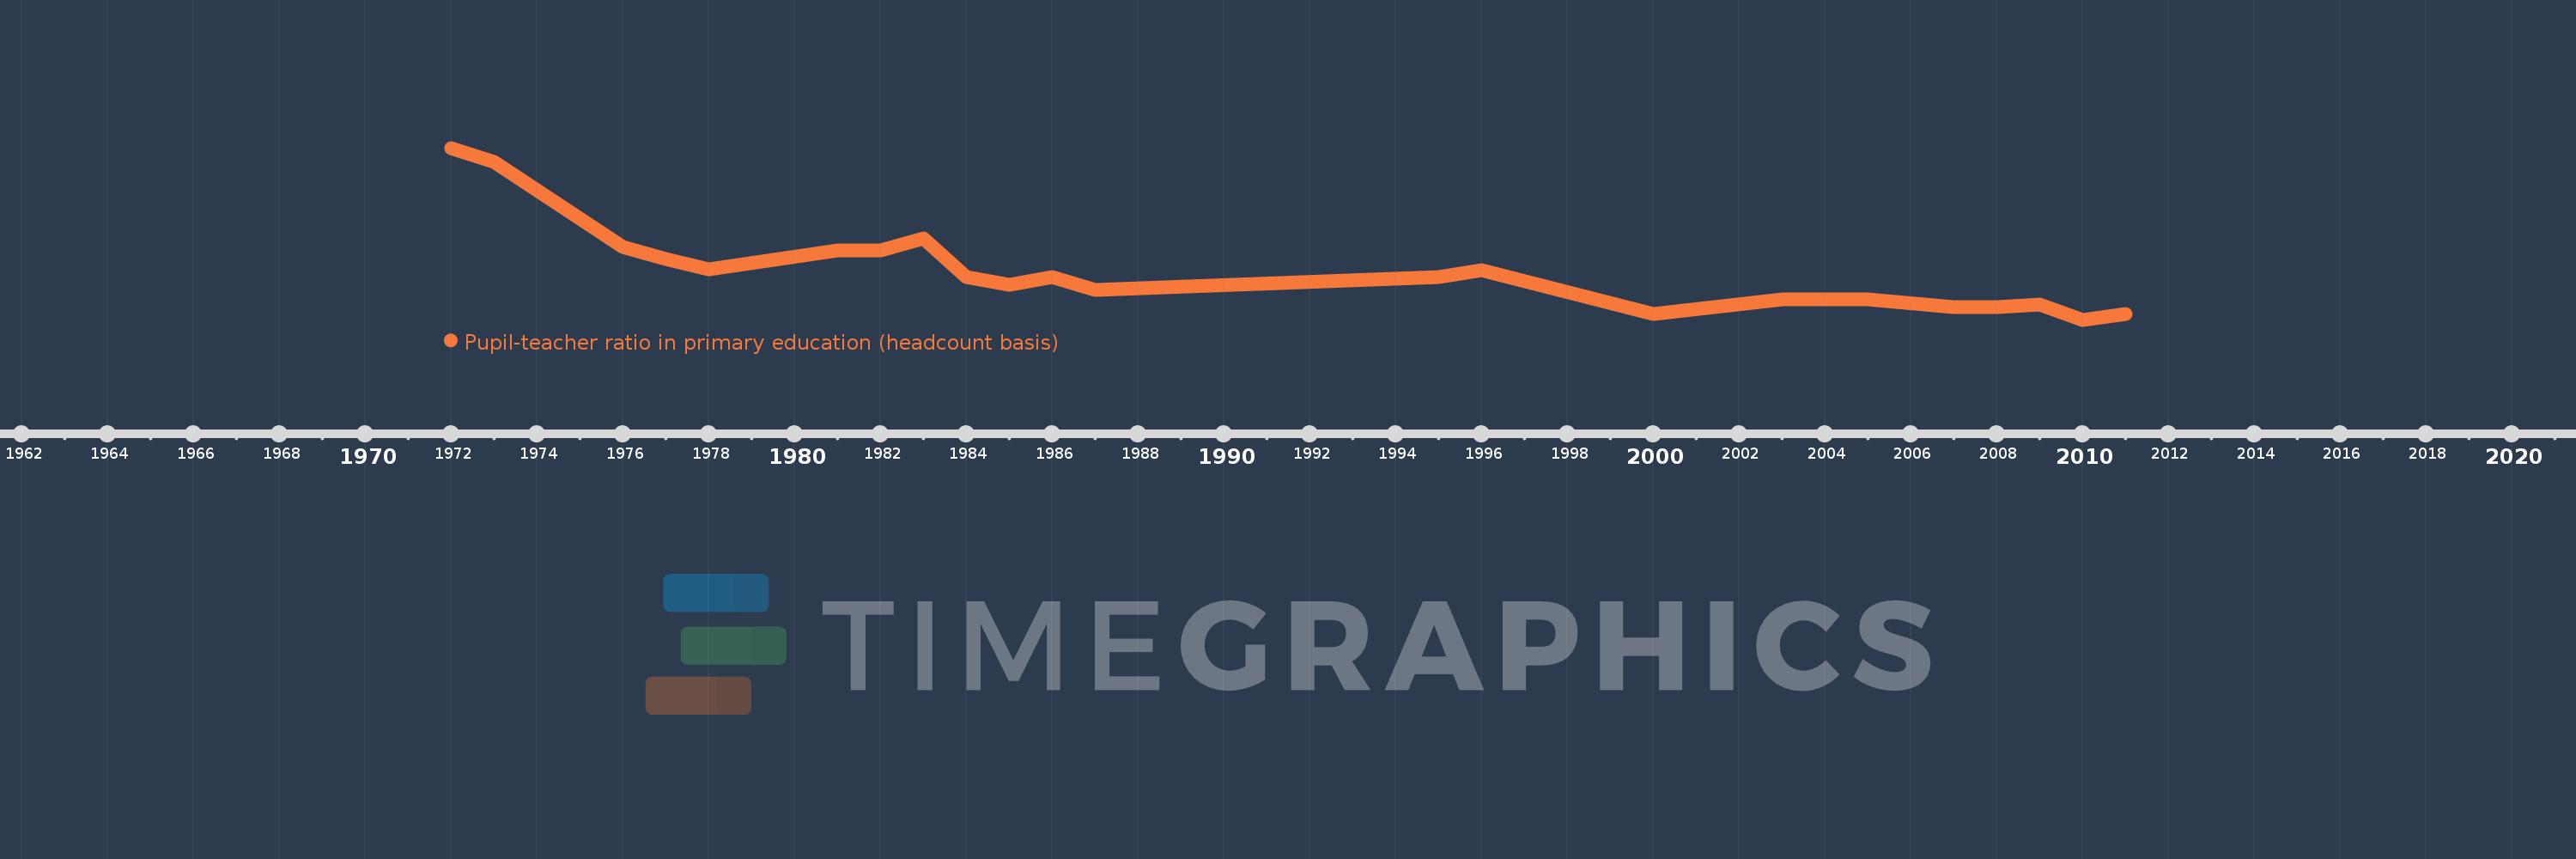
Pupil-teacher ratio in primary education (headcount basis)
2011,2010,2009,2008,2007,2005,2003,2000,1996,1995,1987,1986,1985,1984,1983,1982,1981,1978,1977,1976,1973,1972