33
/
AIzaSyB4mHJ5NPEv-XzF7P6NDYXjlkCWaeKw5bc
November 30, 2025
280346
Vanuatu
VUT
true
2
1
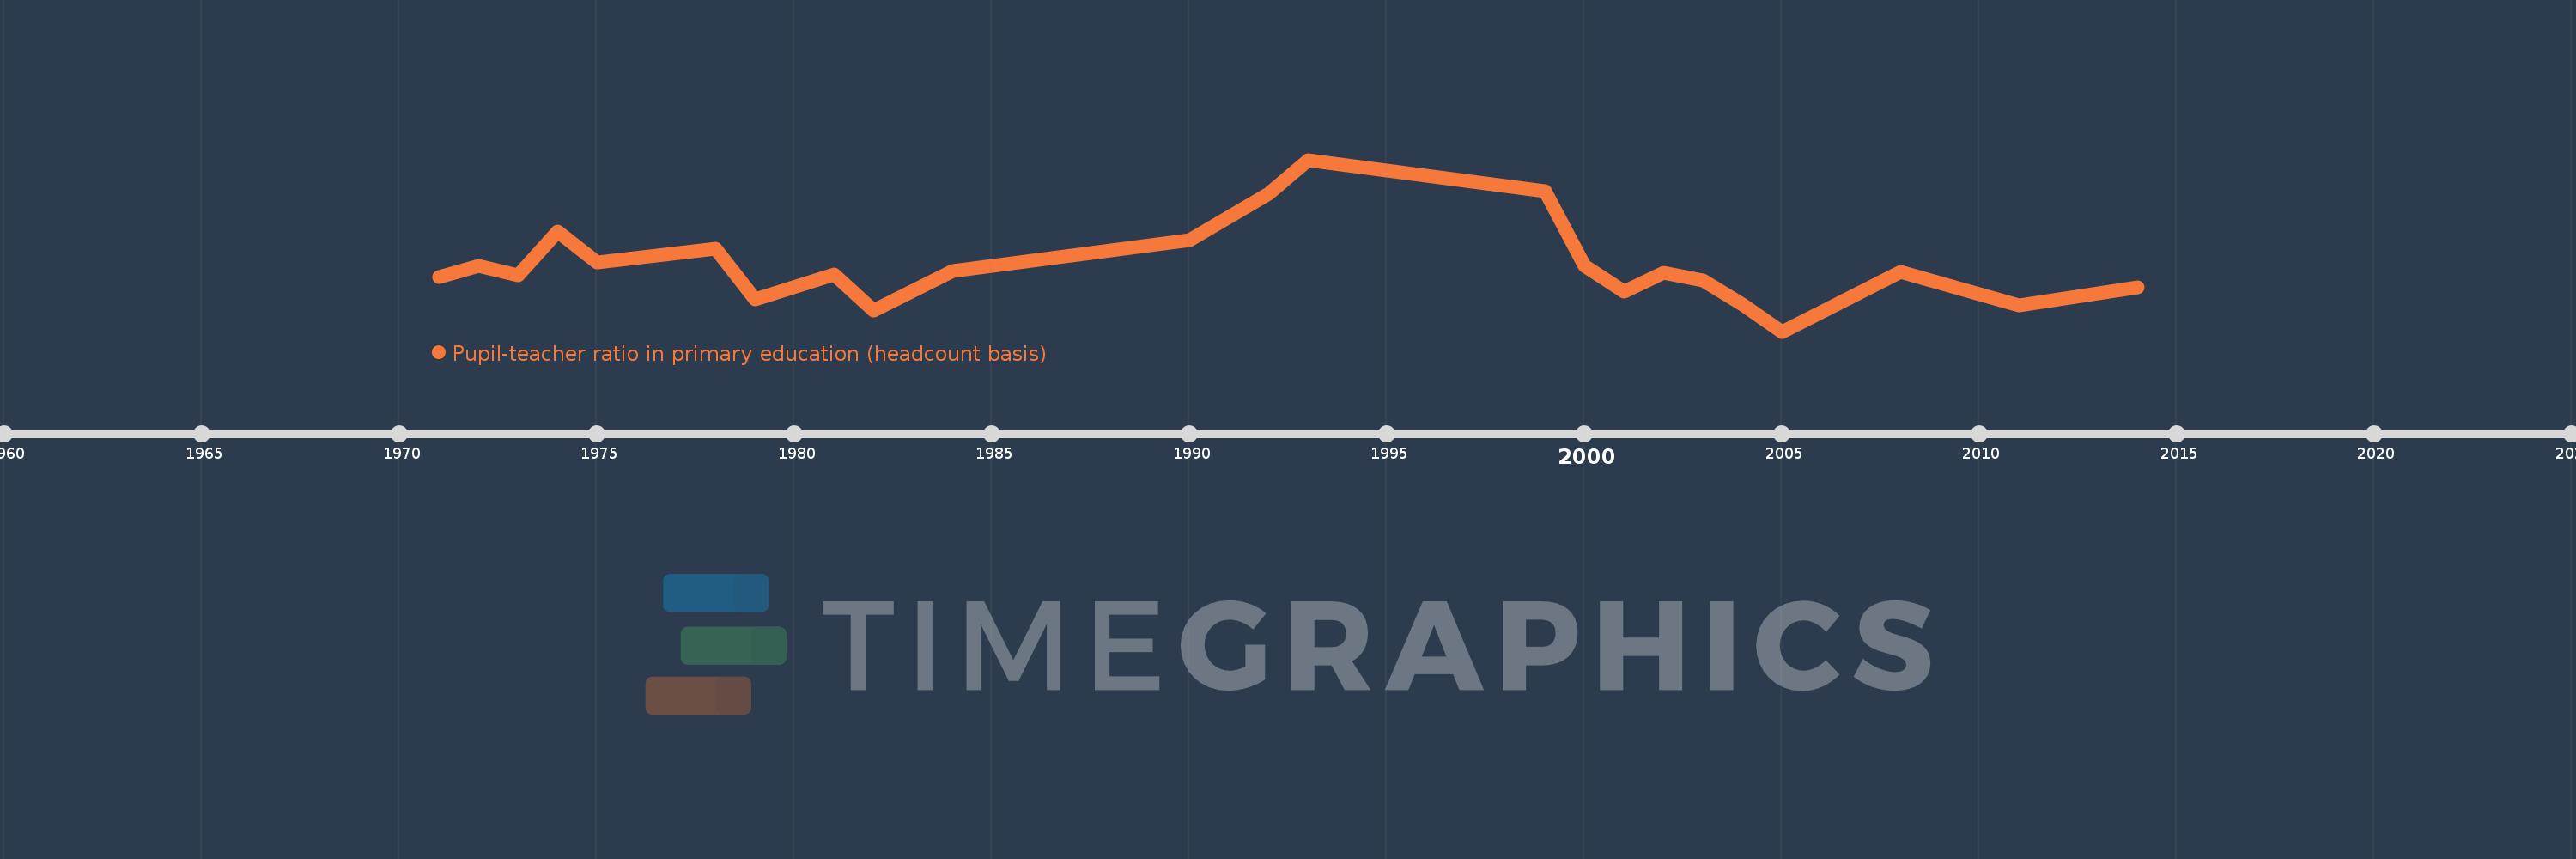
Pupil-teacher ratio in primary education (headcount basis)
2014,2011,2008,2005,2004,2003,2002,2001,2000,1999,1993,1992,1990,1984,1982,1981,1979,1978,1975,1974,1973,1972,1971