33
/
AIzaSyB4mHJ5NPEv-XzF7P6NDYXjlkCWaeKw5bc
November 30, 2025
122803
Dominican Republic
DOM
true
2
1
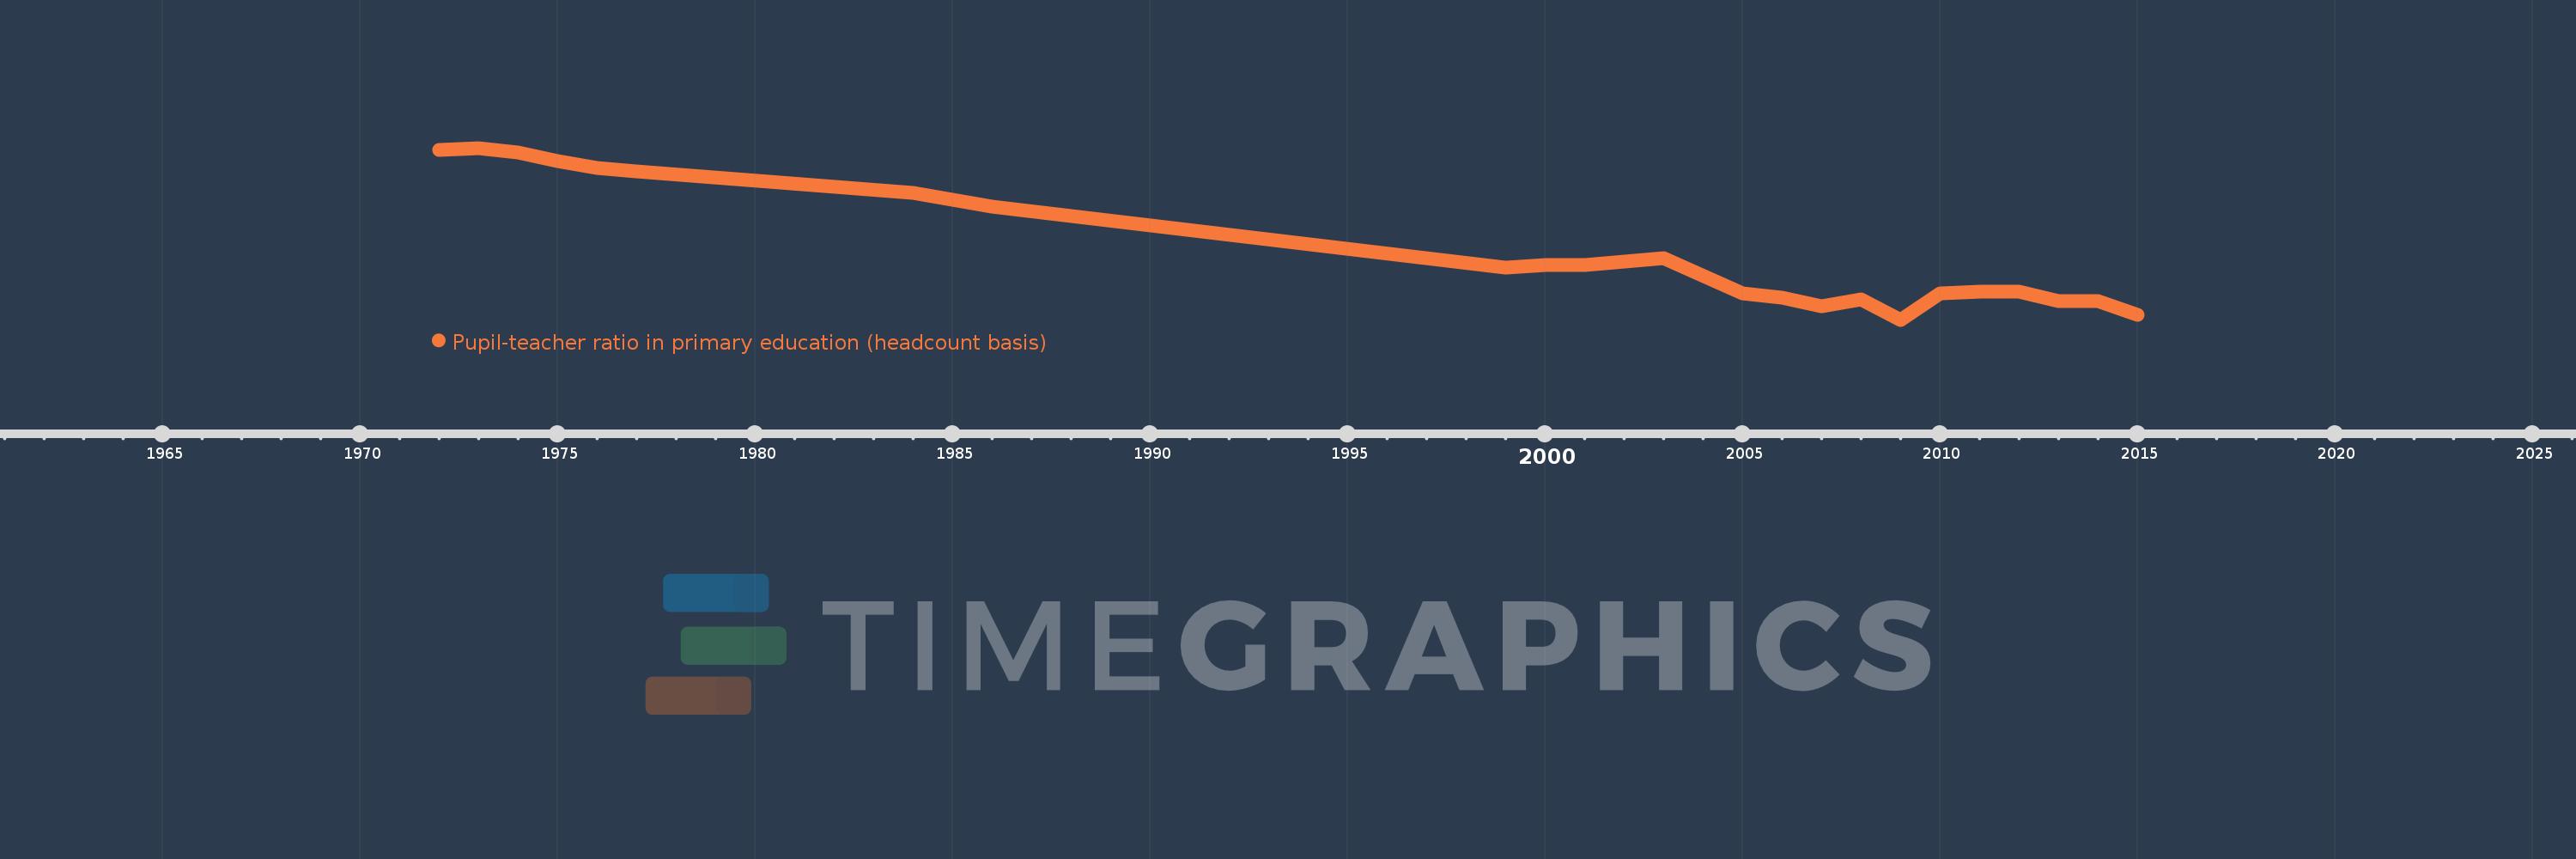
Pupil-teacher ratio in primary education (headcount basis)
2015,2014,2013,2012,2011,2010,2009,2008,2007,2006,2005,2003,2001,2000,1999,1986,1984,1977,1976,1975,1974,1973,1972