33
/
AIzaSyB4mHJ5NPEv-XzF7P6NDYXjlkCWaeKw5bc
November 30, 2025
163213
Jamaica
JAM
true
2
1
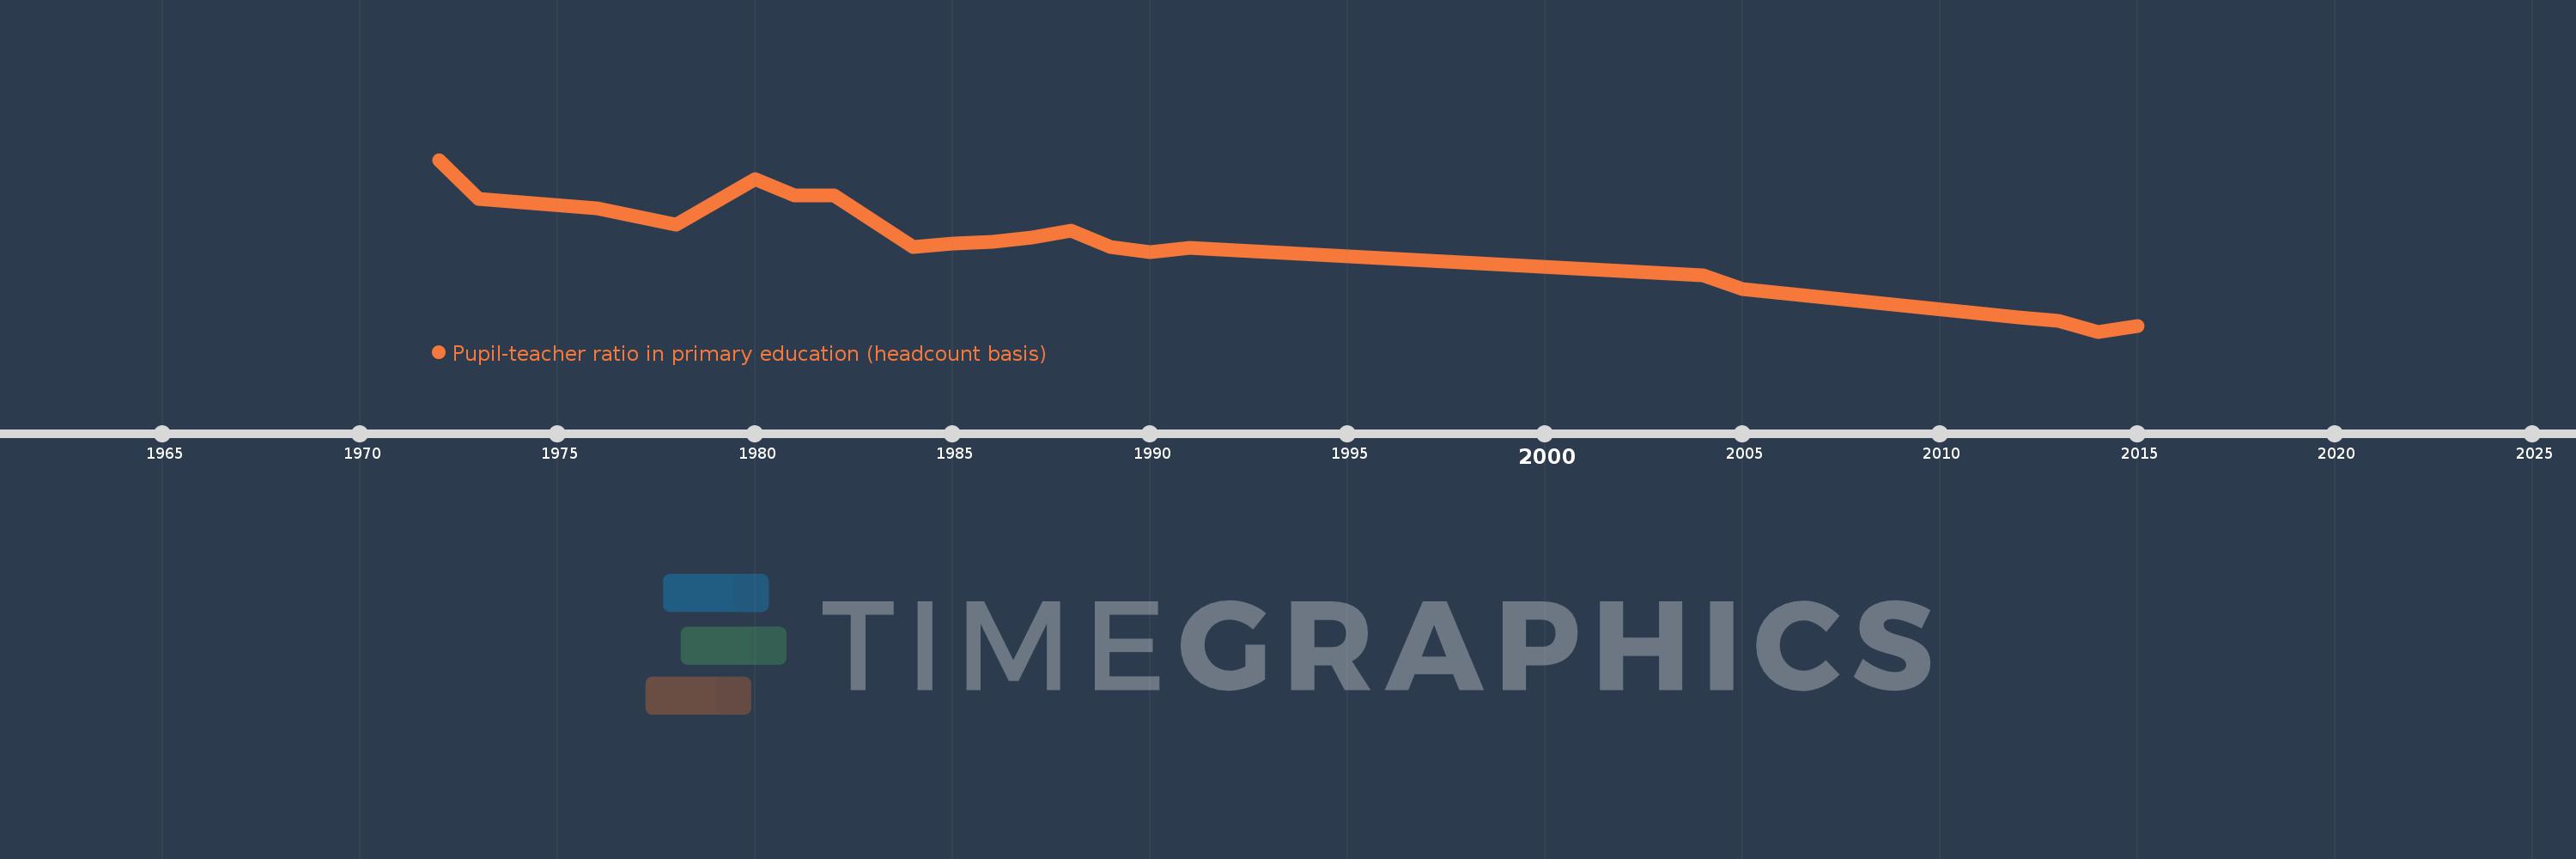
Pupil-teacher ratio in primary education (headcount basis)
2015,2014,2013,2012,2005,2004,1991,1990,1989,1988,1987,1986,1985,1984,1982,1981,1980,1978,1976,1973,1972