33
/
AIzaSyB4mHJ5NPEv-XzF7P6NDYXjlkCWaeKw5bc
November 30, 2025
75064
Azerbaijan
AZE
true
2
1
Gross fixed capital formation, private sector (current LCU)
2008,2007,2006,2005,2004,2003,2002,2001,2000,1999,1998,1997,1996,1995,1994
Create a timeline
Public Timelines
For education
For educational institutions
For teachers
For students
Cabinet
For educational institutions
For teachers
For students
Open cabinet
FAQ
Close
Create a timeline
Public timelines
FAQ
About & Feedback
Terms
Privacy
FAQ
Support 24/7
Cabinet
Get premium
Donate
Download
Global statistics library
→
Azerbaijan
→
Gross fixed capital formation, private sector (current LCU)
This statistics in other country:
Albania
Algeria
Angola
Antigua and Barbuda
Armenia
Australia
Azerbaijan
Bangladesh
Barbados
Belarus
Belize
Benin
Bhutan
Bolivia
Bosnia and Herzegovina
Botswana
Brazil
Bulgaria
Burkina Faso
Burundi
Cabo Verde
Cambodia
Cameroon
Central African Republic
Chad
Colombia
Comoros
Congo, Dem. Rep.
Congo, Rep.
Costa Rica
Cote d'Ivoire
Croatia
Djibouti
Dominica
Dominican Republic
Ecuador
Egypt, Arab Rep.
El Salvador
Equatorial Guinea
Eritrea
Ethiopia
Fiji
Gabon
Gambia, The
Georgia
Ghana
Grenada
Guatemala
Guinea
Guinea-Bissau
Guyana
Haiti
Honduras
Hong Kong SAR, China
India
Iran, Islamic Rep.
Iraq
Jamaica
Japan
Jordan
Kazakhstan
Kenya
Kosovo
Kyrgyz Republic
Lao PDR
Lebanon
Lesotho
Liberia
Libya
Macedonia, FYR
Madagascar
Malawi
Malaysia
Mali
Mauritania
Mauritius
Mexico
Moldova
Mongolia
Montenegro
Mozambique
Namibia
Nepal
Nicaragua
Niger
Oman
Pakistan
Panama
Papua New Guinea
Paraguay
Peru
Philippines
Romania
Russian Federation
Rwanda
Senegal
Serbia
Seychelles
Sierra Leone
South Africa
South Sudan
Sri Lanka
St. Kitts and Nevis
St. Lucia
St. Vincent and the Grenadines
Sudan
Suriname
Swaziland
Syrian Arab Republic
Tajikistan
Tanzania
Thailand
Timor-Leste
Togo
Trinidad and Tobago
Tunisia
Turkey
Turkmenistan
Uganda
Ukraine
United Arab Emirates
United States
Uruguay
Uzbekistan
Venezuela, RB
Yemen, Rep.
Zimbabwe
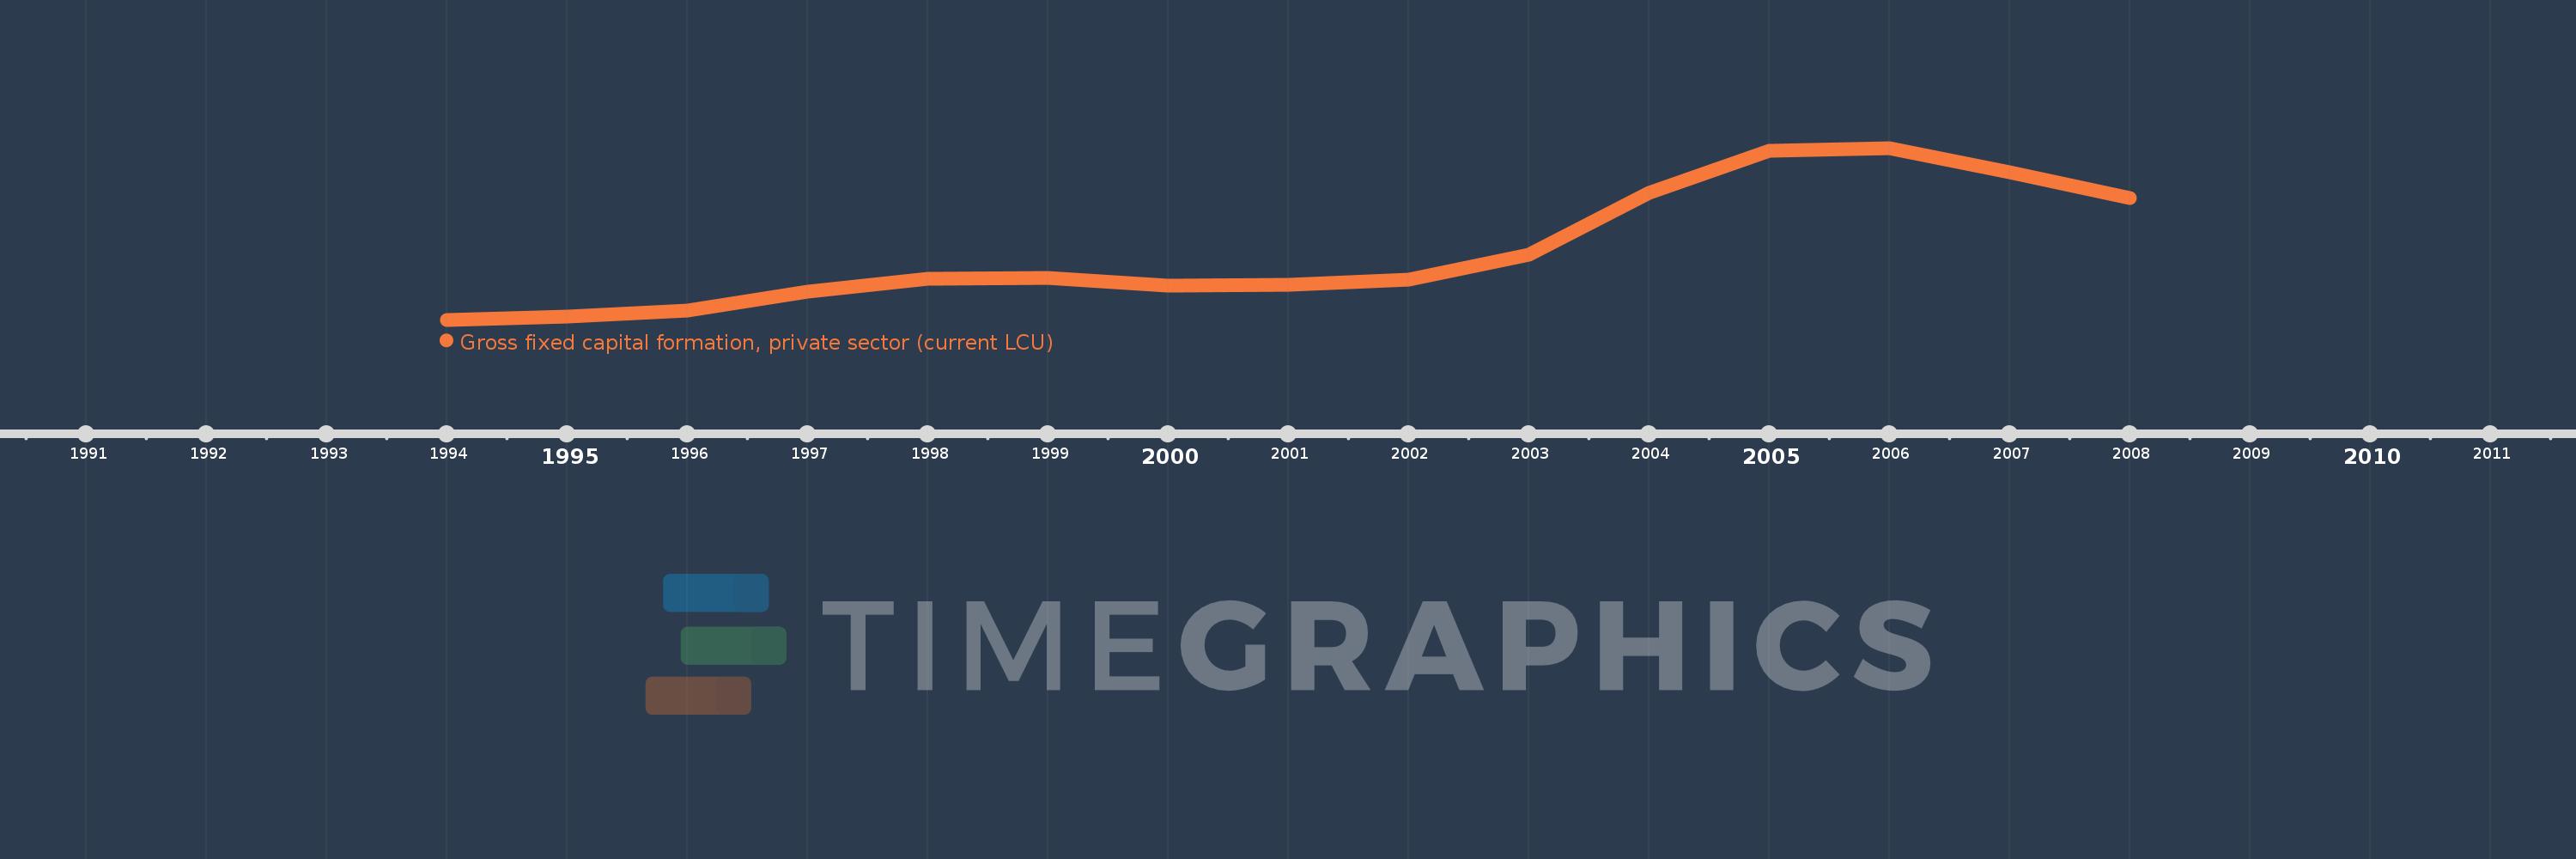
Timeline:
This timeline shows a graph from
1994
to
2008
of Azerbaijan. No data until
1993
. Number of actual observations by date:
15
.
Source name:
World Development Indicators
Source organization:
World Bank national accounts data, and OECD National Accounts data files.
Categories, topics:
Economy & Growth
Last updated:
apr 23, 2017
Indicators value changes by year
Meaning:
1.891 bln
Minimum:
5.902 mln
jan 1, 1994
Maximum:
4.696 bln
jan 1, 2006
At the date of observation
Value
Absolute change
Change from the previous value
jan 1, 1994
5.902 mln
+5.902 mln
0.0%
jan 1, 1995
96.137 mln
+90.235 mln
1.53K%
jan 1, 1996
266.147 mln
+170.01 mln
176.84%
jan 1, 1997
774.22 mln
+508.073 mln
190.9%
jan 1, 1998
1.124 bln
+350.04 mln
45.21%
jan 1, 1999
1.159 bln
+34.544 mln
3.07%
jan 1, 2000
937.786 mln
-221.019 mln
-19.07%
jan 1, 2001
949.01 mln
+11.225 mln
1.2%
jan 1, 2002
1.105 bln
+156.008 mln
16.44%
jan 1, 2003
1.785 bln
+679.86 mln
61.52%
jan 1, 2004
3.476 bln
+1.691 bln
94.77%
jan 1, 2005
4.612 bln
+1.136 bln
32.67%
jan 1, 2006
4.696 bln
+83.688 mln
1.81%
jan 1, 2007
4.035 bln
-660.558 mln
-14.07%
jan 1, 2008
3.338 bln
-696.837 mln
-17.27%
Ranking of countries by current statistics by years
About & Feedback
Terms
Privacy
FAQ
Support 24/7
Cabinet
Get premium
Donate
The service accepts bank transfer (ACH, Wire) or cards (Visa, MasterCard, etc). Processed by Stripe.
Secured with SSL